March 2026 Trading Activity Holds Steady as Volatility Persists
D Prime March 2026 trading volume reflects a market that stayed volatile but struggled to find clear direction.
March did not slow down.
If February was about markets cooling, March was about markets hesitating without settling. Volatility stayed. Direction did not.
Prices moved fast, reversed faster, and left traders navigating a market driven more by reaction than conviction.
This was not a breakout month.
It was a battle between uncertainty and opportunity.
March 2026 Key Trading Volume Highlights
• Total trading volume: USD 125.85B (+2.18% MoM)
• Average daily volume: USD 4.06B (−7.71% MoM)
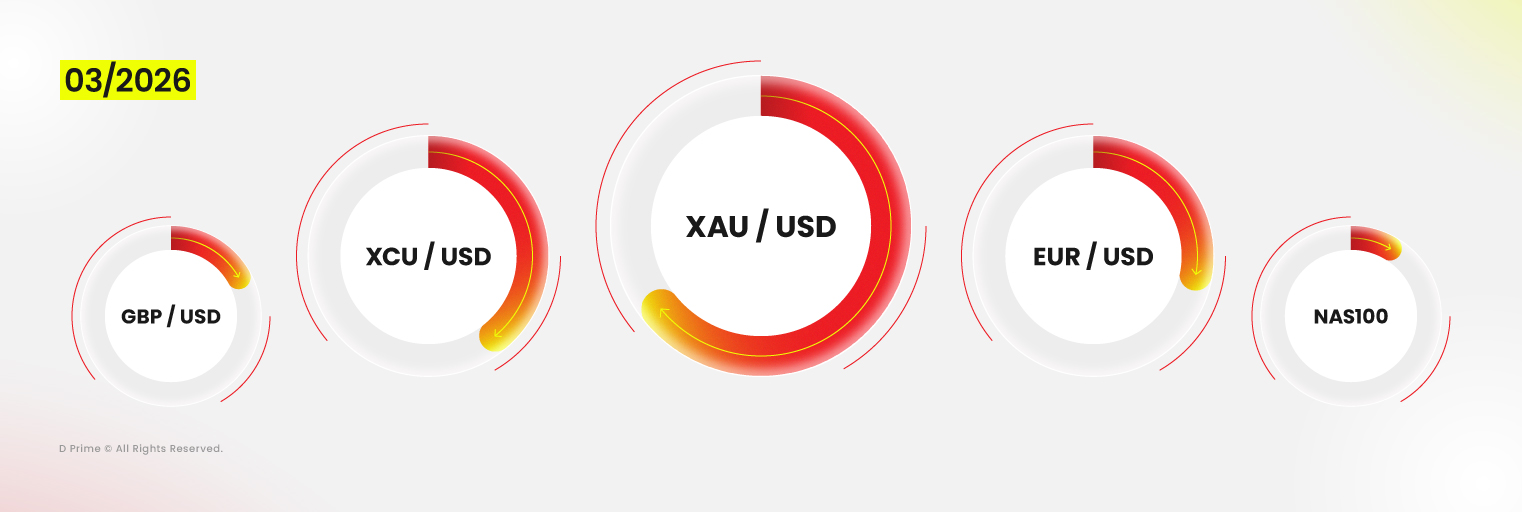
• Top traded products: XAUUSD, XCUUSD, EURUSD, GBPUSD, NAS100
• Largest volume increase: XAUUSD (+USD 4.124B)
• Fastest growth: USDCNH (+2,890.78%)
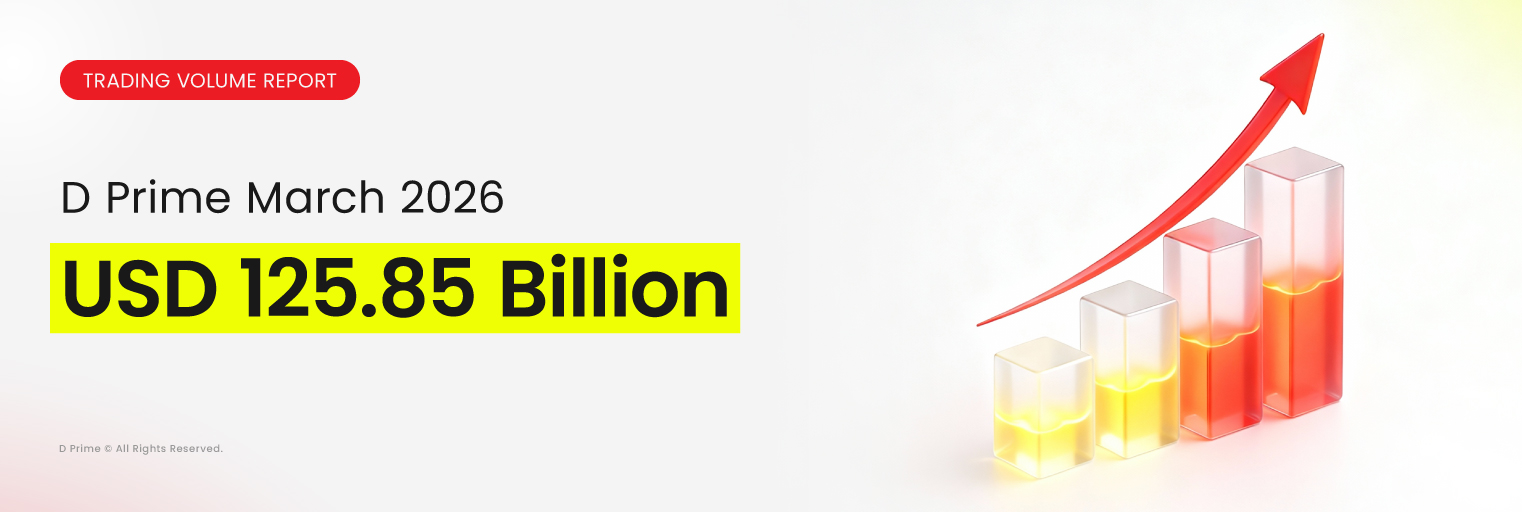
D Prime Trading Volume Report — March 2026: USD 125.85 Billion
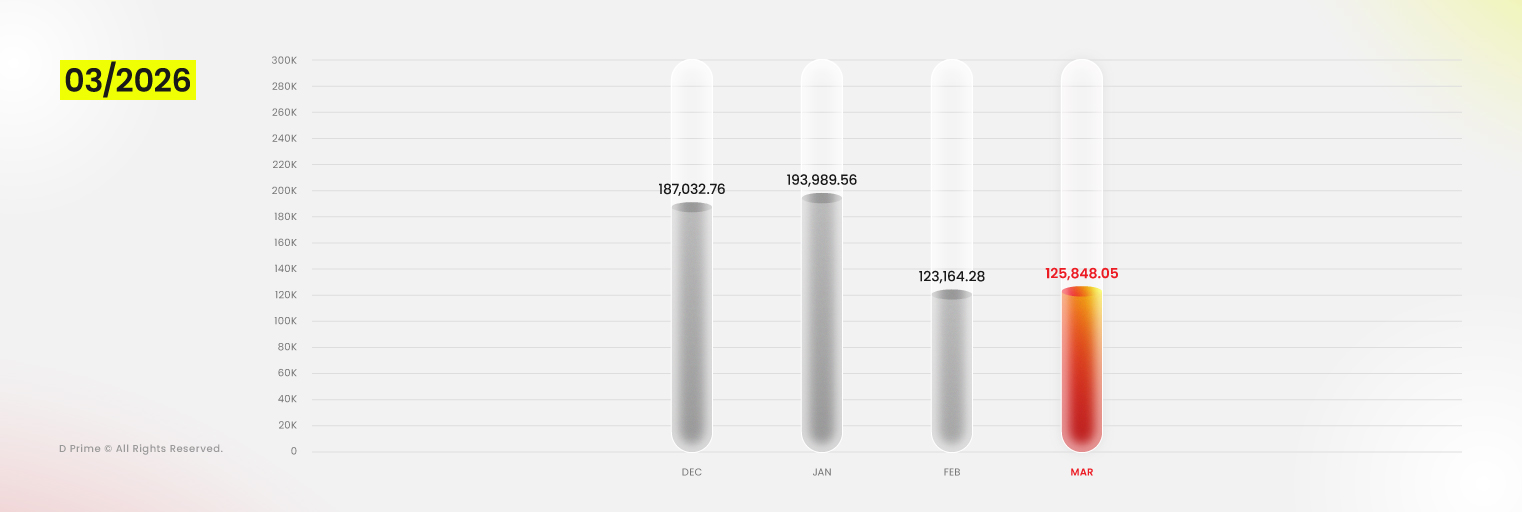
In March 2026, D Prime recorded a total trading volume of USD 125.85 billion, marking a 2.18% increase from February.
However, average daily volume (ADV) declined to USD 4.060 billion, down 7.71% month on month.
That divergence tells the real story.
Trading activity remained present, but conviction was uneven.
Markets were active, just not decisive.
When Volatility Stays but Direction Fades
March was shaped by macro uncertainty stacking on top of itself.
The Federal Reserve held interest rates steady. But at the same time, it raised inflation forecasts and lowered growth expectations.
That combination created friction.
Markets were left asking:
Is policy still restrictive?
Or is easing just delayed?
This uncertainty did not reduce volatility.
It redistributed it.
Instead of clean trends, markets moved in bursts, reversals, and hesitation.
And that kind of environment changes how traders behave.
Gold Becomes the Center of the Storm
If one asset defined March, it was gold.
The spot gold market (XAUUSD) delivered sharp, high-level swings throughout the month.
Prices surged to a monthly high of USD 5,238 per ounce on March 10, before reversing sharply under pressure from rising US real yields and hawkish Fed expectations.
By March 23, gold had dropped to a monthly low near USD 4,099 per ounce.
Then sentiment shifted again.
Persistent geopolitical risks and emerging dovish signals helped stabilize prices, with gold rebounding to around USD 4,696 per ounce by month-end.
This was not a trend.
It was a sequence of reactions.
And reactions create trades.
Why XAUUSD Dominated Trading Activity
This environment made XAUUSD the most actively traded product by a wide margin.
Gold did not just move.
It moved unpredictably.
That created:
- breakout attempts
- reversals
- intraday volatility
- multi-day swings
As a result, XAUUSD recorded the largest increase in trading volume, rising approximately USD 4.124 billion compared with February.
In uncertain markets, traders look for assets that respond.
Gold did exactly that.
Copper Holds While Markets Search for Direction
While gold captured attention, copper (XCUUSD) continued to hold its position as a high-interest asset.
Supported by global energy transition demand and tight supply conditions, copper remained elevated and volatile.
Unlike gold, copper’s movement was less emotional.
But it was consistent.
That consistency kept traders engaged, especially those looking for structured, trend-supported setups.
USDCNH Explodes Into Focus
The most surprising move in March came from USDCNH.
Trading volume surged 2,890.78%, making it the fastest-growing product of the month.
This was not random.
It was driven by two key forces:
- US dollar strength cycles
- shifting global risk sentiment
As volatility expanded in the offshore yuan, traders began paying closer attention to currency-driven opportunities.
A low base effect amplified the percentage growth.
But the underlying driver was clear.
FX volatility is back and traders are noticing.
Where Traders Stayed Active
Despite uncertainty, trading activity remained concentrated in core markets.
The most traded products were:
• XAUUSD
• XCUUSD
• EURUSD
• GBPUSD
• NAS100
These reflect continued focus on:
Even without clear direction, traders stayed active where liquidity and volatility remained strong.
What March’s Trading Volume Really Signals
The D Prime March 2026 trading volume tells a different story than January or February.
January was explosive.
February cooled.
March hovered in between.
This was a market searching for direction.
Volatility remained.
Conviction did not.
And in that gap, trading becomes more tactical.
Less about long trends.
More about timing.
Uncertainty Still Shapes the Market Outlook
As markets move forward, several key themes remain unresolved:
- the balance between inflation and growth
- ongoing geopolitical risks
- the role of US dollar strength across asset classes
These forces are not fading.
They are building.
And when they align, markets tend to move decisively again.
At D Prime, the focus remains unchanged.
Whether markets trend, pause, or reverse, D Prime continues to deliver:
- deep liquidity
- reliable execution
- access to global trading opportunities
Because in markets like March, staying ready matters more than being right.
Risk Disclosure
Trading in Securities, Futures, contracts for difference (CFDs) and other financial products carries high risks due to the rapid and unpredictable fluctuation in the value and prices of these financial instruments. This unpredictability is due to the adverse and unpredictable market movements, geopolitical events, economic data releases, and other unforeseen circumstances. You may sustain substantial losses including losses exceeding your initial investment within a short period of time.
You are strongly advised to fully understand the nature and inherent risks of trading with the respective financial instrument before engaging in any transactions with us. When you engage in transactions with us, you acknowledge that you are aware of and accept these risks.
Disclaimer
The information contained herein is provided for general informational and educational purposes only and does not constitute investment advice, financial advice, trading advice or any other form of professional advice, a recommendation, or an offer or solicitation to buy or sell any financial instruments or engage in any trading strategy.
Trading in leveraged products such as contracts for difference (CFDs) involves a significant risk of loss and may not be suitable for all investors. Past performance is not indicative of future results. Any references to market trends, asset performance, price levels, or forward-looking statements reflect opinions or general market commentary as at the date of publication and are subject to change without notice.
This article does not take into account any individual investor’s objectives, financial situation, or risk tolerance. Readers should conduct their own independent research and seek professional advice before making any investment or trading decisions. D Prime and its affiliates make no representations or warranties about the accuracy or completeness or reliability of this information and disclaim any and all liability for any direct, indirect, incidental, consequential, or other losses or damages arising out of or in connection with the use of or reliance on any information contained herein. The above information should not be used or considered as the basis for any trading decisions or as an invitation to engage in any transaction. Do not rely on this article to replace your independent judgment.
“D Prime” is a brand name of D Prime Vanuatu Limited, a company incorporated and regulated by the Vanuatu Financial Services Commission (Company Number: 700238). The availability of products and services may vary depending on jurisdiction and applicable regulatory requirements.