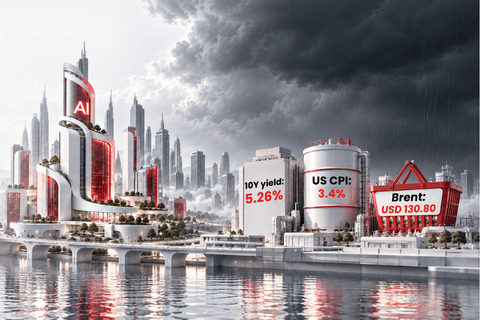


Explore the 2026 mid-year market outlook as AI drives growth, liquidity shapes risk assets, and traders watch the Fed, US dollar, gold, oil and FX markets.
First Half Recap: AI Won, Gold Disappointed, Oil Shocked Markets
The first half of 2026 did not move quietly.
It moved like a market thriller.
The US-Iran war became the biggest black swan of the year, catching traders completely off guard. One week, the market was pricing in negotiations. The next week, it was reacting to attacks. Oil prices moved with every headline, while the original rate-cut narrative was suddenly interrupted by the return of rate-hike fears.
The message was clear: liquidity was no longer guaranteed.
Stocks also delivered a major plot twist.
Memory chips became the star of the market. Micron became one of the most watched names on Wall Street, while the Mag 7 failed to impress. Gold, usually treated as the classic safe haven during chaos, also disappointed. The old belief that “gold shines in crisis” did not fully play out this time.
Now, we are halfway through 2026.
The key question is no longer whether AI is real.
The question is whether AI can keep carrying the global economy while inflation, energy prices and central banks push back.
So where could markets go in the second half? Which asset classes still have room to move? And what should traders actually watch next?
The New Kondratieff Cycle Is Being Built Around AI
AI remains the most important structural story in global markets.
From a macro perspective, it may mark the beginning of a new Kondratieff cycle, a long-term growth cycle driven by major technological breakthroughs. But unlike a normal tech rally, this AI cycle is already showing up in real investment, trade and industrial production.
The AI boom has started a new productivity and capacity cycle. Instead of being only a software trend, AI is now driving real-world demand for chips, memory, data centers, servers, storage, power systems and high-speed transmission.
This is why AI still matters for markets.
It is not only lifting selected tech stocks. It is also reshaping industrial production, global trade and capital expenditure.
AI Is Now Showing Up in Real Trade Data
The AI story is no longer just about hype or future expectations.
According to WTO data, AI-related products accounted for one-sixth of total global trade in 2025 and contributed 42% of that year’s trade growth.
That is a major signal.
AI is already creating measurable economic value, and this helps explain why markets continue to reward companies connected to the AI infrastructure chain.
For traders, this matters because long-term market themes become more durable when they are supported by real trade, real investment and real earnings.
AI Infrastructure Is Driving Capex and Industrial Output
AI infrastructure has become one of the biggest drivers of the current capacity cycle.
In the US, overall capacity utilization has continued to rise this year, reaching 76.17% in May. The industrial production index has also climbed steadily, reaching 1.67% in May.
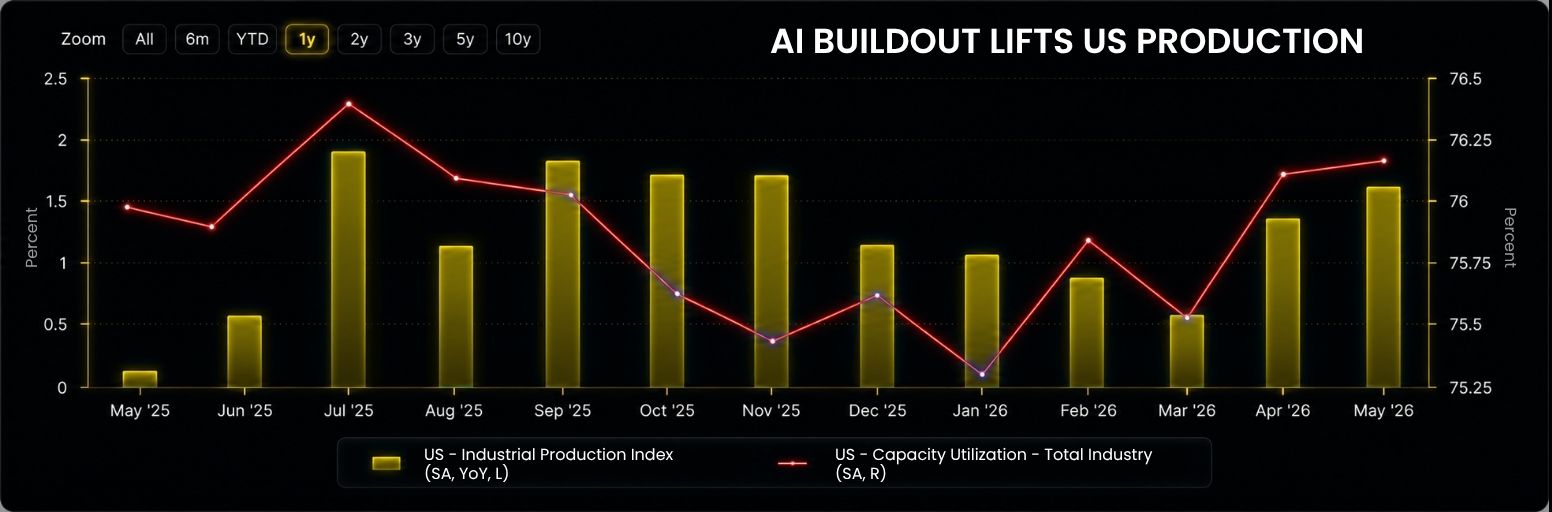
This reflects growing demand for the physical infrastructure behind AI, including chips, data centers, power capacity and hardware supply chains.
Capital spending also remains strong.
In 2026, combined capital expenditure by the Mag 7 reached USD 135.97 billion. In Q1 2026, US data center investment growth exceeded 22%, showing a strong uptrend.
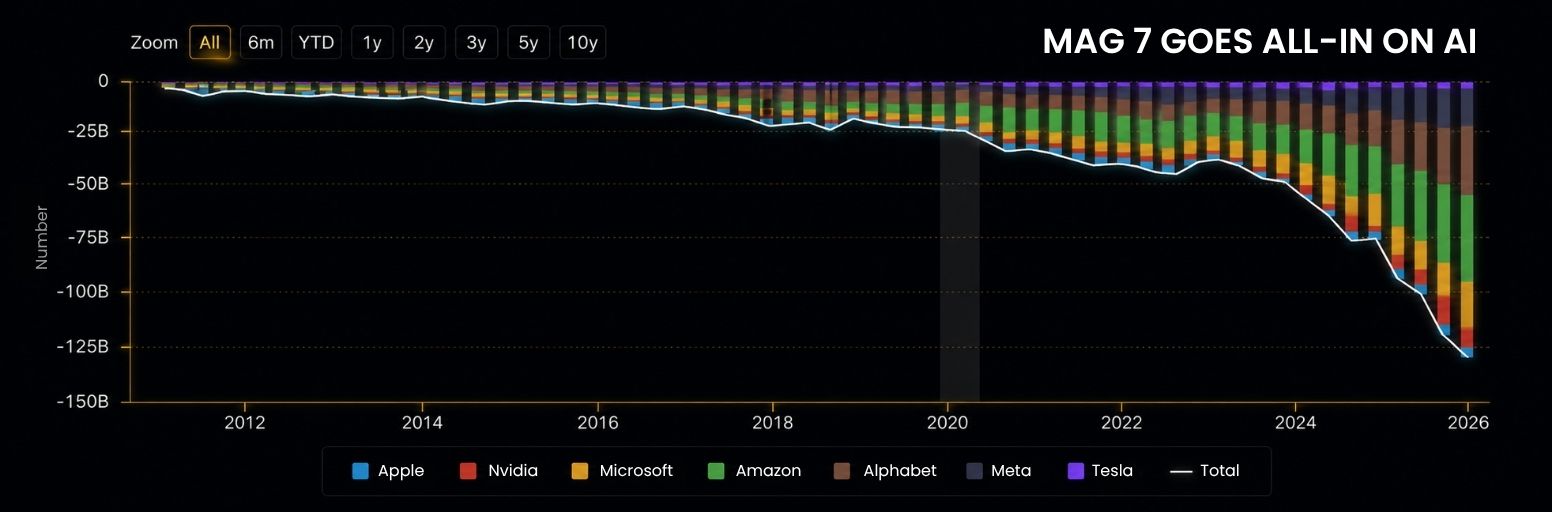
These numbers show that the AI race is still in its infrastructure buildout stage.
Behind every AI model upgrade is a much larger physical investment cycle.
Asia Is Riding the AI Hardware Cycle
The AI infrastructure boom is also supporting major Asian economies.
In the first five months of 2026, South Korea’s exports rose 43.2%. In the first four months, semiconductor exports alone grew 148.1%.
China’s exports rose 15.5% in the first five months of 2026. Combined growth in integrated circuits and automatic data processing equipment reached 63.1%, becoming the core driver of China’s export growth.
This shows that the AI boom is not limited to US tech stocks.
It is also benefiting hardware exporters, semiconductor supply chains and manufacturing-heavy economies.
For now, hardware remains one of the strongest winners of the AI cycle.
The K-Shaped Economy: AI Booms, Consumers Struggle
The AI boom is powerful, but it is not lifting every part of the economy equally.
This is the core tension of the 2026 market outlook.
AI-related industries are expanding quickly, but many traditional sectors remain weak. The global economy is showing a clear K-shaped divergence: one side is rising fast, while the other side is struggling to keep up.
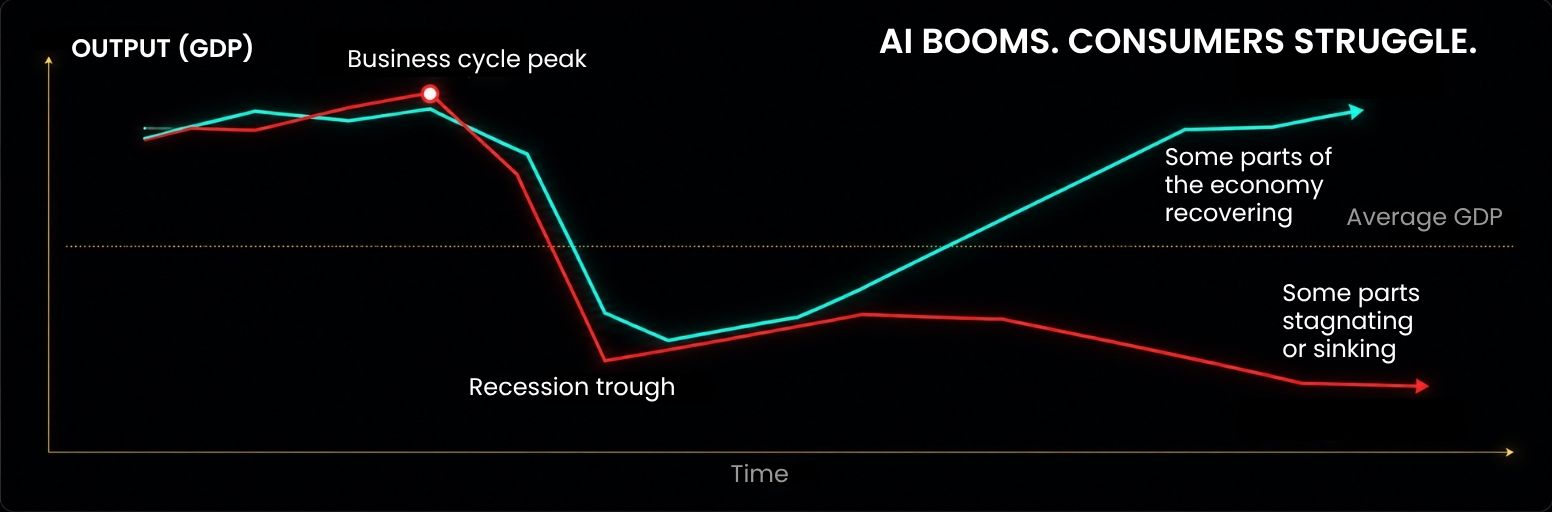
That creates both opportunity and risk.
For traders, the key is to separate genuine structural growth from areas that are still under pressure.
Manufacturing Looks Strong
US manufacturing data remains resilient.
The latest ISM Manufacturing PMI came in at 54, above the forecast of 53.3 and the previous reading of 52.7. The Markit Manufacturing PMI reached 55.7, higher than the previous reading of 55.1 and the forecast of 54.6.
On the surface, this suggests that the industrial sector remains confident.
But the details are more uneven.
Data from the San Francisco Fed shows that nearly all capital investment growth since 2024 has come from AI-related companies. In other words, the current capacity cycle appears heavily tied to AI, while capital spending in other industries has only increased slightly.
That means the economy is not broadly booming.
AI is booming.
Consumers and Housing Remain Weak
The consumer side of the economy looks much softer.
Average hourly wage growth for US workers continues to hit new lows. At the same time, inflation remains elevated due to the US-Iran war and higher energy prices.
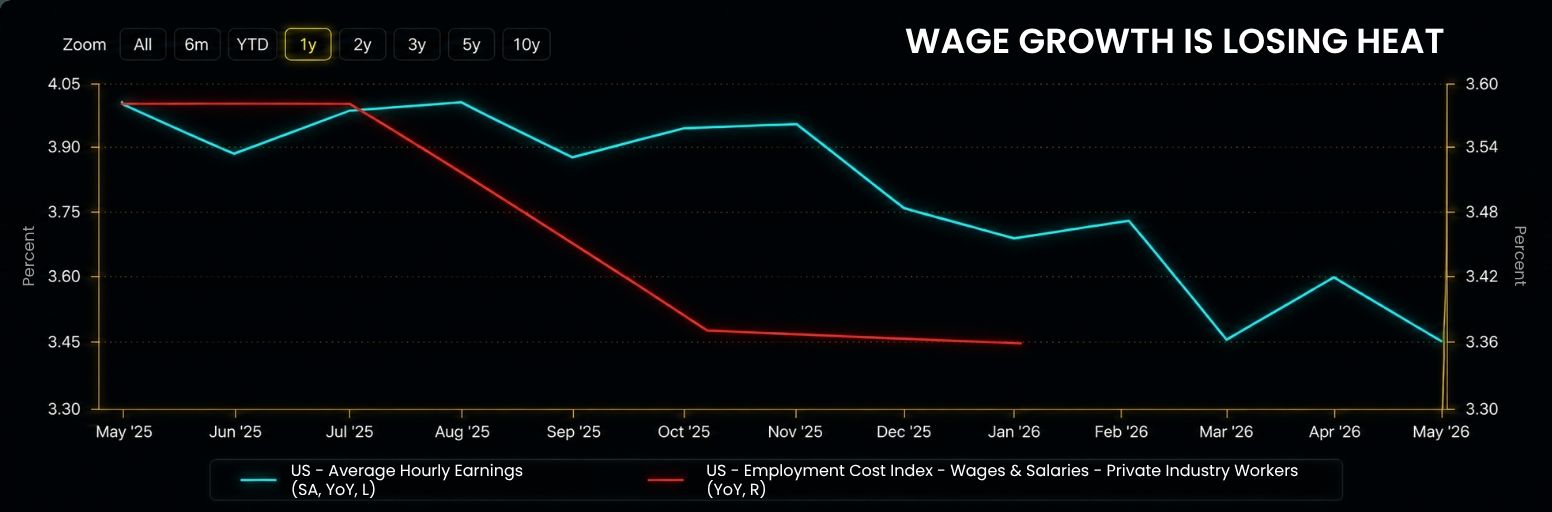
That is a tough combination for households.
In June, the University of Michigan Consumer Sentiment Index stood at 49.5. This was higher than May’s 44.8, but it was still the second-lowest level in the past 10 years.
Housing is also under pressure.
US housing starts fell 15.4% month over month in May, reaching the lowest level since May 2020. High mortgage rates continue to weigh on housing demand.
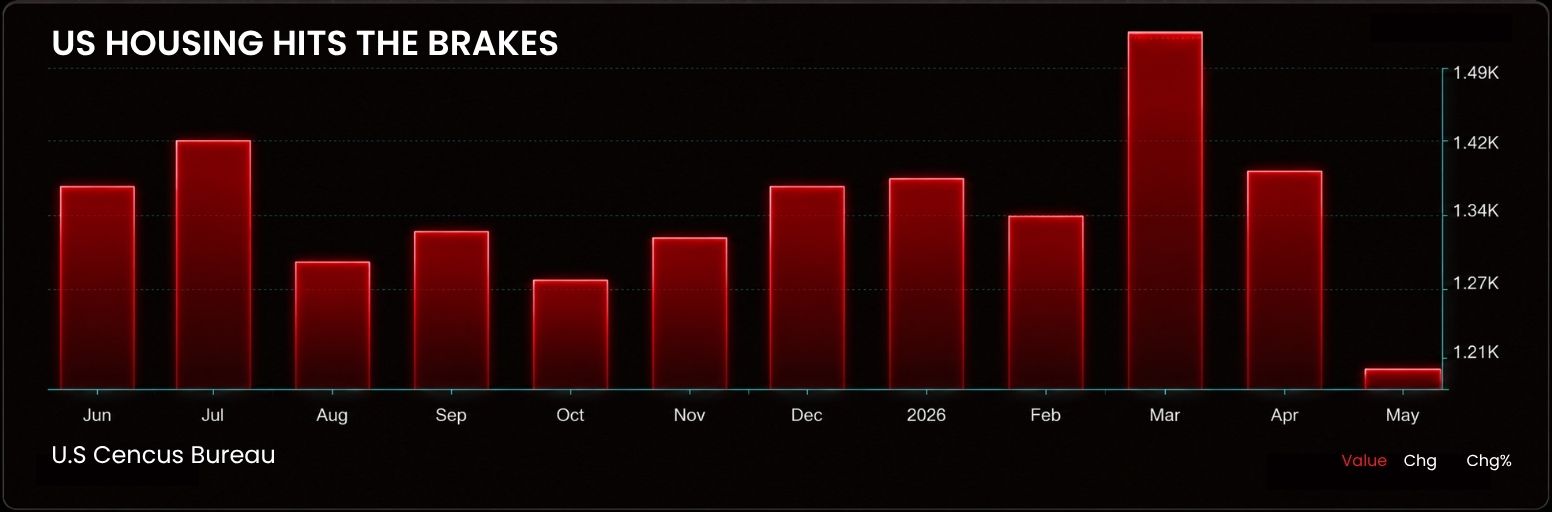
This gives the Fed a difficult problem.
If it raises rates too aggressively, it may hurt consumption, housing and even the AI infrastructure cycle. But if it stays too loose while inflation remains sticky, price pressure may become harder to control.
That is why Fed policy remains one of the biggest risks for the second half of 2026.
Europe and Japan Are Recovering, But Still Lag the US
Outside the US, major economies are showing signs of mild recovery.
However, the recovery is uneven, and the US still appears stronger than both the Eurozone and Japan.
This matters for currency markets.
A stronger US growth outlook, combined with higher Fed policy uncertainty, could continue to support the US dollar against the euro and yen.
Europe Is Stabilizing, But Energy Dependence Remains a Risk
The Eurozone remains highly exposed to energy shocks.
It relies on imports for around 97% of its crude oil and petroleum products. Even though Europe has pushed hard for energy transition, its net import dependence on fossil fuels still exceeds 57%.
This makes oil prices a major risk for the region.
In May, Eurozone HICP reached 3.2%, in line with market expectations, while energy prices rose 10.8%. UK CPI rose 2.8% year over year in May, below the forecast of 3%, partly helped by the UK’s North Sea oil fields.
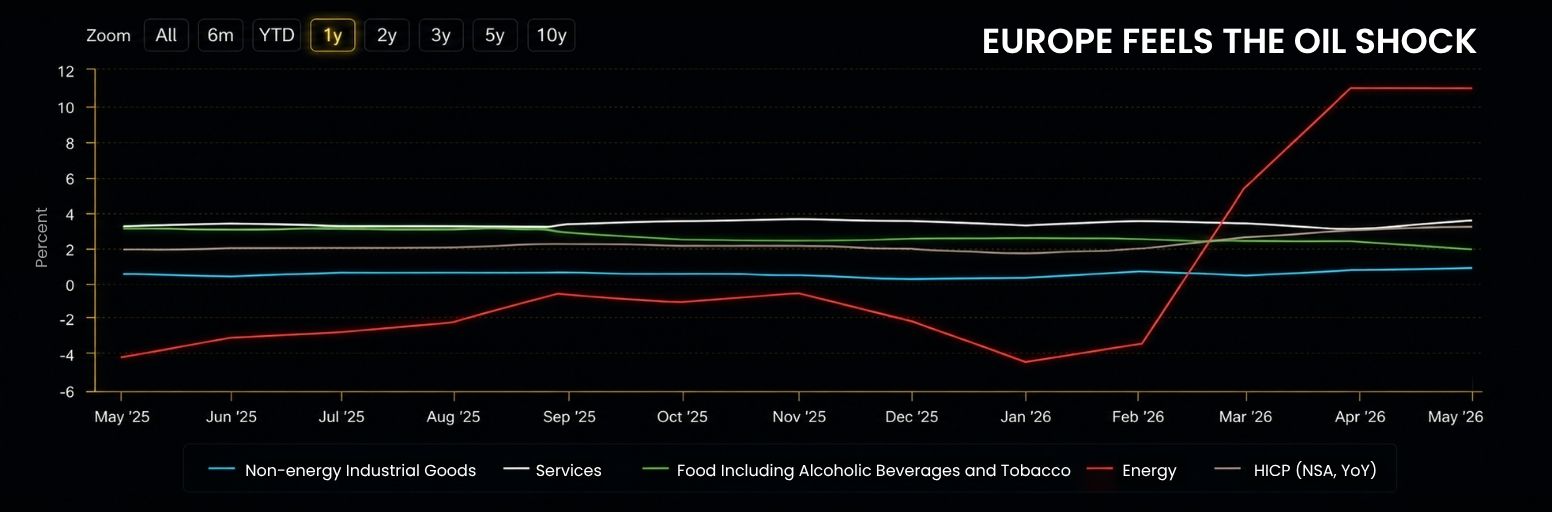
Despite energy pressure, Eurozone industrial data has started to improve.
In April, Eurozone exports rose 5% year over year, compared with the previous reading of -5.1%. Its seasonally adjusted industrial production index rose 0.3% year over year, improving from the previous reading of -2.8%.
Germany also benefited from the rebound in exports. Its GDP growth rate exceeded the Q1 2023 level for the first time.
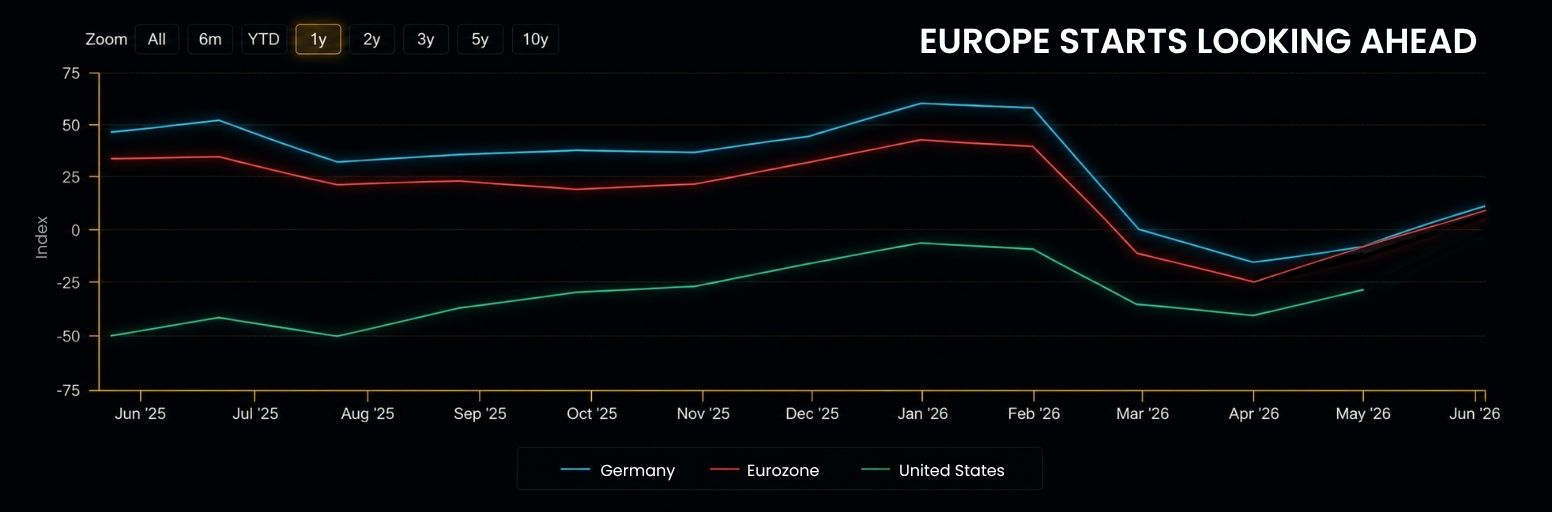
In June, the ZEW leading indicators for Germany and the Eurozone came in at 10.5 and 9.5, respectively, turning positive from negative territory. This was the first time the indicators had turned positive since falling below zero in February, when the US-Iran war began.
The takeaway is simple.
Europe is not collapsing, but its recovery remains fragile and energy-sensitive.
Japan Has Semiconductor Support, But Energy Costs Are Dragging
Japan also shows a mixed picture.
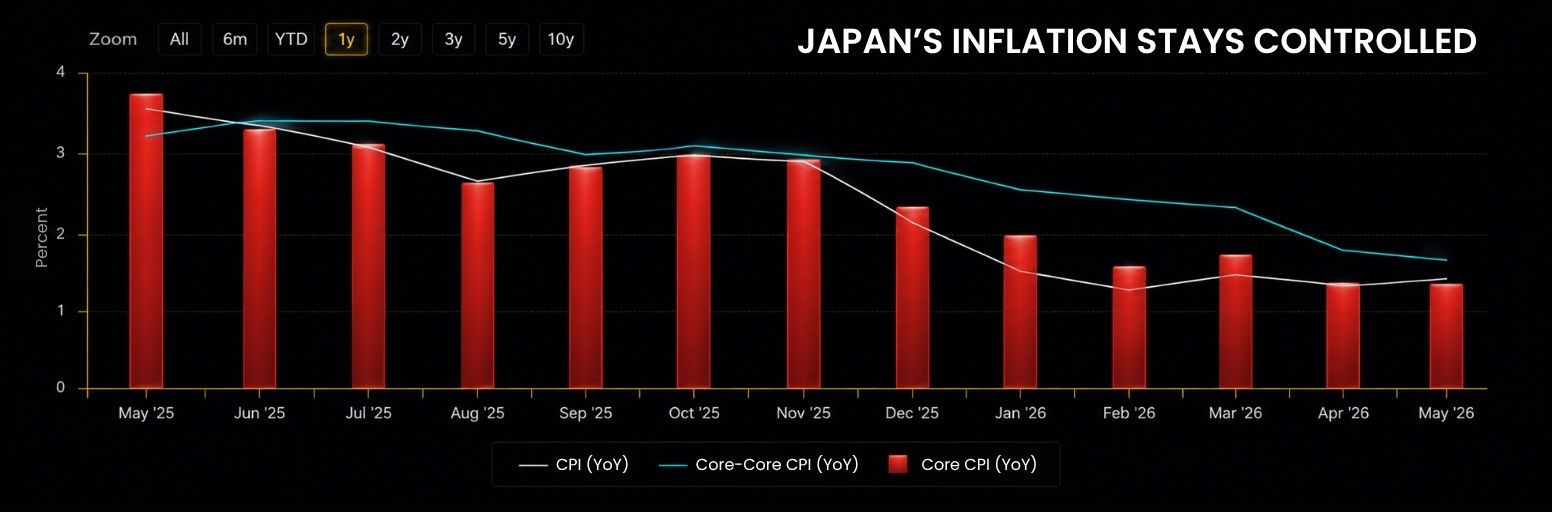
In May, Japan’s headline CPI rose 1.5% year over year, slightly above the previous reading of 1.4%. Core CPI, which excludes fresh food, rose 1.4% year over year. CPI excluding both fresh food and energy rose 1.8% year over year.
Food was the main inflation driver, rising 3.5% year over year. Energy prices fell 2.5% year over year, mainly because the Japanese government introduced large subsidies for electricity and fuel costs.
However, those subsidies are gradually being phased out, while energy costs remain vulnerable to geopolitical risk.
Japan continues to benefit from its role in the global semiconductor supply chain. Exports rose 17.0% in May, up from the previous reading of 14.8%. Imports rose 12.5%, higher than the previous reading of 9.8%.
However, faster import growth pushed Japan’s May trade balance from surplus into deficit.
The weak yen and semiconductor boom have supported exports, but rising energy and raw material costs have turned net exports negative.
That is not a good sign.
In the current cycle, the US remains the main driver of the technology revolution. The Eurozone and Japan are recovering, but their recoveries remain weaker.
This year, US GDP growth is forecast at 1.7% to 2.3%. The Eurozone is expected to grow only 0.8% to 1.1%, while Japan is expected to grow 0.5% to 0.9%.
This growth gap supports the case for a relatively strong US dollar.
Fed Policy Is the Biggest Market Swing Factor
The second half of 2026 may depend heavily on one question:
How much liquidity will the Fed allow?
AI may be driving growth, but liquidity still determines how much investors are willing to pay for that growth.
If inflation cools and the Fed becomes less hawkish, risk assets could gain support. But if oil prices stay elevated and inflation remains sticky, the Fed may be forced to keep policy tight for longer.
That would create pressure across stocks, gold and rate-sensitive assets.
Rate-Cut Hopes Were Interrupted
The US-Iran war interrupted the earlier G7 rate-cut cycle.
Australia has already delivered three rate hikes this year. The EU and Japan have also followed with rate hikes. In contrast, the US, UK and Canada are taking a wait-and-see approach for now.
All three have signaled that they may introduce policy measures quickly if inflation begins to spread.
Among all central banks, the Fed remains the main focus.
The federal funds rate has stayed high for an extended period, creating heavy interest payment pressure for the US government. At the same time, interest spending continues to push up the federal deficit, making inflation control even more important.
This leaves the Fed with little room for policy mistakes.
Warsh May Rely on Balance Sheet Reduction
Fed Chair Kevin Warsh appears more focused on inflation and balance sheet reduction than employment.
According to our previous article, “May 2026 Non-Farm Payrolls: Why the Jobs Beat May Not Trigger a Fed Hike” we still believe the Fed is unlikely to raise rates unless energy inflation spreads further. Rate hikes would add pressure to an already fragile economy.
Instead, Warsh may prefer to use balance sheet reduction as his main tool to fight inflation.
The market remains confident that balance sheet reduction is a reliable strategy, as discussed in “Kevin Warsh’s Fed Begins: Will Treasury Yields Break Markets?”
The logic is that Warsh can tighten liquidity without immediately relying on aggressive rate hikes.
But this is still a delicate strategy.
If balance sheet reduction is too aggressive, liquidity-sensitive assets could come under pressure. If it is too slow, inflation may remain sticky.
This is why liquidity remains the most important market variable for H2 2026.
Oil Prices Could Keep Inflation Sticky
While US-Iran peace talks have made progress, even if full peace is achieved in the Middle East, it may take around two years to repair damaged oil production facilities and restore output to pre-war levels.
At present, Brent crude remains around USD 75 per barrel.
If oil prices stay near this level over the medium to long term until production fully recovers, inflation may not fall below 2% until mid-2027.
That means the Fed may not be able to declare victory over inflation quickly.
For markets, the question is not only whether oil prices rise again.
It is whether oil keeps inflation high enough to delay liquidity support.
H2 2026 Market Outlook: What Traders Should Watch
Against this backdrop, we still believe the AI stock rally and the strong US dollar trend may continue.
However, the two trends are driven by different forces.
The AI rally is supported by long-term structural growth and may continue for an extended period.
The strong dollar, on the other hand, is mainly driven by Fed rate-hike expectations.
As rate-hike expectations have already been largely priced in, and US-Iran peace talks may make further progress, the strong dollar trend may only last until next year.
US Dollar: Strong, But Likely Range-Bound Later
Warsh’s first public remarks were more hawkish than expected. However, his tone was mainly a response to earlier inflation driven by geopolitical factors. It was more about managing market expectations than signaling that aggressive rate hikes would come quickly.
Because the federal funds rate is already high, the Fed remains cautious about further hikes.
Recently, the US and Iran signed a memorandum of understanding. Although there were new outbreaks of conflict, both sides have remained relatively restrained and agreed to continue negotiations.
If talks go smoothly, the Fed may not need to tighten liquidity at the cost of economic growth.
As of June 25, international oil prices had fallen back near the level seen before the US-Iran war broke out. The average oil price for June was around USD 87, meaning the year-over-year growth rate of US PCE in June may fall as energy inflation eases.
If oil prices later return fully to pre-war levels, the additional inflation pressure from this round of geopolitical conflict could largely fade.
In that case, the Fed’s motivation to keep raising rates would decline significantly, and the expected rate-hike timeline would likely be pushed further back.
If this happens, the US dollar may shift into a high-range trading pattern.
EUR/USD and USD/JPY: Key FX Pairs to Watch
EUR/USD and USD/JPY are two currency pairs worth watching.
During the recovery phase of the Kondratieff cycle, US economic fundamentals remain stronger than those of the Eurozone and Japan. This supports the US dollar against both the euro and the yen.
However, traders should remain cautious about the risk of Japanese currency intervention.
Gold: Long-Term Hedge, Short-Term Range Trade
Gold has been one of the best-performing assets in recent years, but it has performed poorly recently due to shocks from inflation and rate-hike expectations.
In the long run, gold still has allocation value.
Geopolitical competition between major powers is likely to continue. Gold also remains a natural inflation hedge and can work well as a risk hedge, especially during stagflation periods.
However, gold is currently trading within a broad range. It lacks a clear one-sided trend in the short term, making it more suitable for long-term risk hedging than short-term momentum trading.
Final Takeaway: AI Leads, Liquidity Decides
AI remains the strongest growth engine heading into H2 2026, but the broader recovery is still uneven.
For traders, the key question is whether liquidity improves or tightens further. If inflation cools, risk assets may find more room to move. If oil prices stay elevated, the Fed may stay cautious for longer.
In short, AI may lead the market, but liquidity will decide how far the rally can go.
By D Prime Analysis Team
Macro and market strategy research by D Prime’s in-house analysis team.
Disclaimer
The information contained herein is provided for general informational and educational purposes only and does not constitute investment advice, financial advice, trading advice or any other form of professional advice, a recommendation, or an offer or solicitation to buy or sell any financial instruments or engage in any trading strategy.
Trading in leveraged products such as contracts for difference (CFDs) involves a significant risk of loss and may not be suitable for all investors. Past performance is not indicative of future results. Any references to market trends, asset performance, price levels, or forward-looking statements reflect opinions or general market commentary as at the date of publication and are subject to change without notice.
This article does not take into account any individual investor’s objectives, financial situation, or risk tolerance. Readers should conduct their own independent research and seek professional advice before making any investment or trading decisions. D Prime and its affiliates make no representations or warranties about the accuracy or completeness or reliability of this information and disclaim any and all liability for any direct, indirect, incidental, consequential, or other losses or damages arising out of or in connection with the use of or reliance on any information contained herein. The above information should not be used or considered as the basis for any trading decisions or as an invitation to engage in any transaction. Do not rely on this article to replace your independent judgment.
“D Prime” is a brand name of D Prime Vanuatu Limited, a company incorporated and regulated by the Vanuatu Financial Services Commission (Company Number: 700238). The availability of products and services may vary depending on jurisdiction and applicable regulatory requirements.