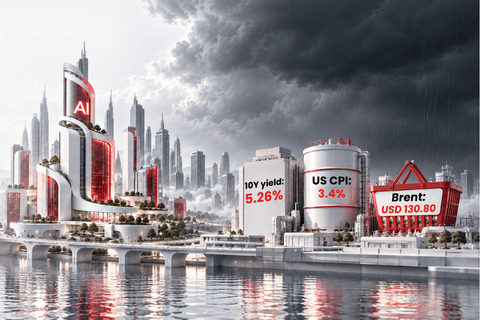


Kevin Warsh has officially taken over the Federal Reserve, bringing a reform-driven approach to inflation, balance sheet reduction and monetary policy.
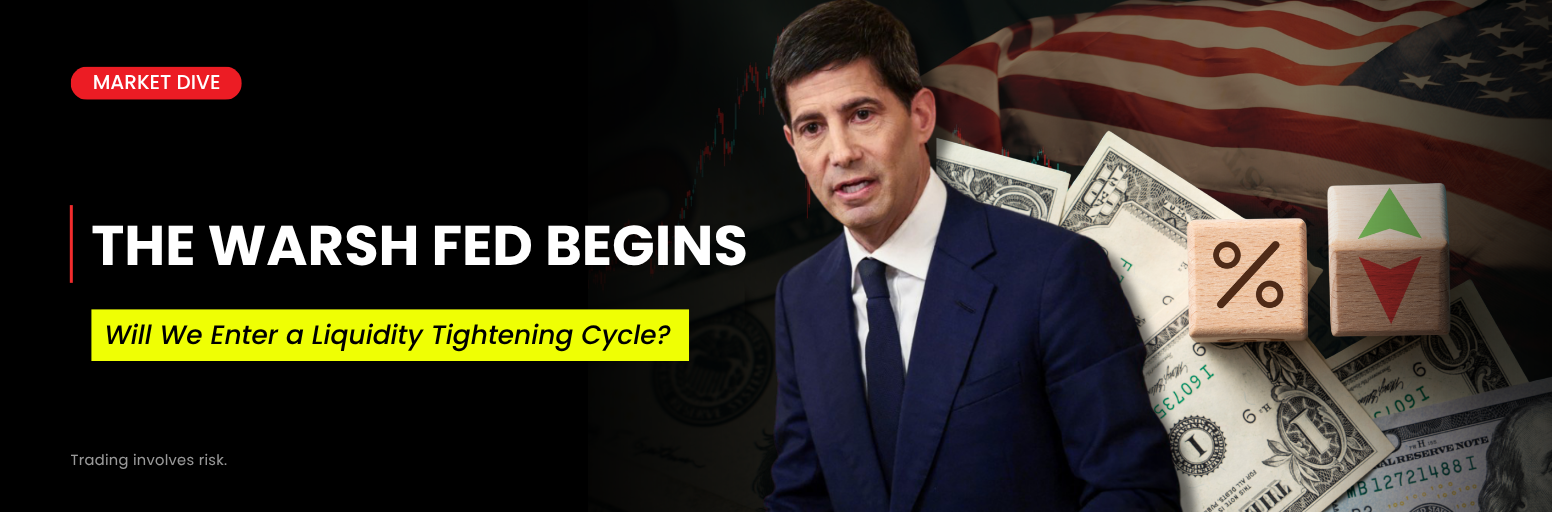
Goodbye, Powell.
Kevin Warsh officially assumed leadership of the Federal Reserve on May 22, 2026, pledging to build a more “reform-oriented Fed” while reaffirming his commitment to fighting inflation.
But Warsh is entering one of the most difficult policy environments in recent years.
Oil prices remain near $100 per barrel.
US Treasury yields have climbed above 4.5%.
Semiconductor stocks continue trading at elevated valuations.
Inflation risks remain persistent.
Fiscal pressure is still rising.
For traders, the question is simple:
Can Warsh tighten liquidity without breaking the market?
In this article, we look at four key questions:
- Is the rise in US Treasury yields inevitable?
- What changes will Warsh bring to the Fed?
- How will balance sheet reduction work under Warsh?
- How should investors position across major asset classes?
Quick Takeaways
- US Treasury yields are rising because of sticky inflation, large fiscal deficits and weaker global demand for dollar assets.
- The 5% Treasury yield level is important. If yields reach that zone, risk assets may face stronger pressure.
- AI and semiconductor stocks are still supporting the equity market, but valuations look stretched.
- Warsh may sound hawkish now, but his longer-term goal may be to rebuild room for future rate cuts.
- Balance sheet reduction is likely to come before aggressive rate cuts.
- Gold may stay range-bound, while oil remains driven mainly by Middle East geopolitics.
1. Why US Treasury Yields Keep Rising
US Treasury yields have climbed above 4.5%, and long-term yields are rising faster than short-term yields.
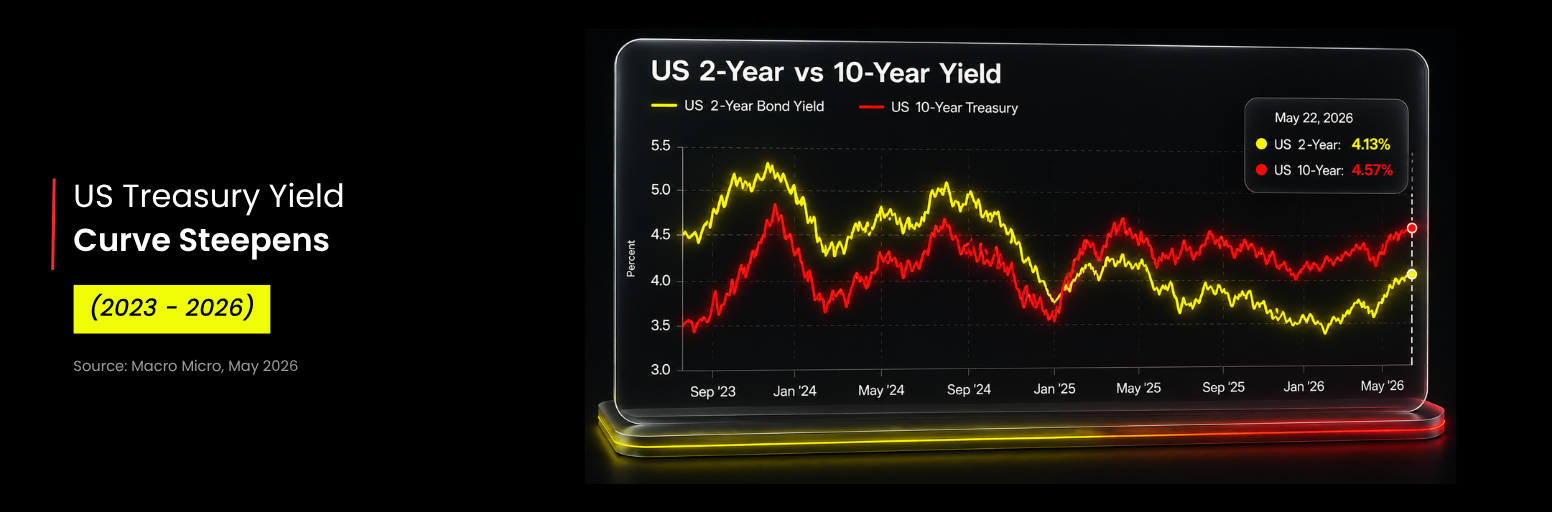
That usually tells us one thing:
Markets are pricing in more persistent inflation.
At first, investors treated inflation as an energy problem. Oil went up, inflation followed, and many expected the pressure to fade.
But now the market is worried that inflation could spread into other areas, including:
- rent
- wages
- services
- consumer prices
When inflation looks sticky, investors demand higher yields to hold long-term bonds. In simple terms, they want more compensation for inflation risk.
The US Deficit Problem Is Adding Pressure
Inflation is not the only reason yields are rising.
The US government is also issuing a huge amount of debt. The federal deficit was already around $1.8 trillion in 2025, and long-term projections suggest deficits could expand further over the next decade.
That creates a supply problem.
The US government needs buyers for all that debt. If demand is not strong enough, yields need to rise to attract investors.
So Treasury yields are being pushed higher by two forces at the same time:
- sticky inflation
- heavy government borrowing
That combination is uncomfortable for the Fed and risky for markets.
What If Treasury Yields Reach 5%?
For traders, 5% is the level to watch.
US Treasuries are still viewed as one of the safest assets in the world. If investors can earn around 5% annually from government bonds, many will ask:
Why take extra risk in stocks?
A 5% Treasury yield could pull capital away from:
- equities
- gold
- speculative assets
- high-growth technology stocks
- liquidity-sensitive sectors
This does not mean the stock market must crash immediately. But it does mean the risk-reward changes.
When safe yields are high, expensive stocks need stronger earnings growth to justify their valuations.
So Why Hasn’t the Stock Market Crashed Yet?
Because one narrative is still powerful enough to fight higher yields:
the AI and semiconductor boom.
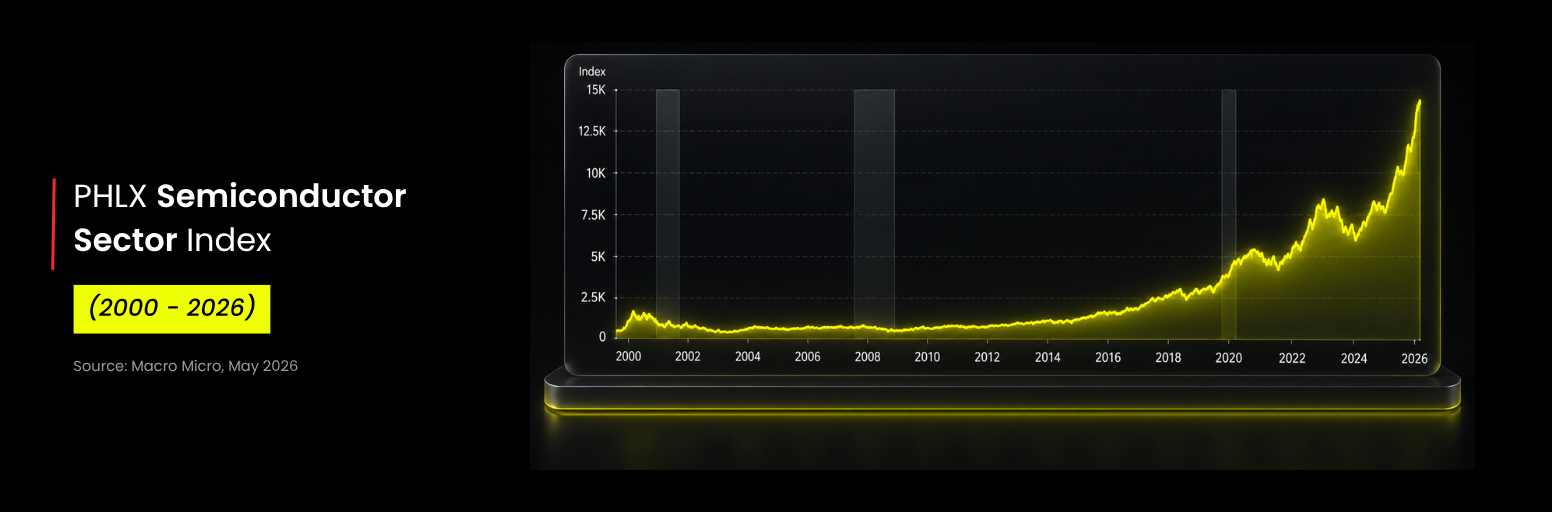
Source: MarcoMicro
The semiconductor rally has kept equity sentiment alive. Earnings growth in leading chip names has been strong enough to offset some concerns about higher yields.
In valuation terms, earnings are still growing fast.
That has helped the market ignore tighter liquidity for now.
But this creates a risk. If the semiconductor rally slows, the market could lose one of its strongest supports. Then the Fed may face a harder problem:
- inflation still needs to be controlled
- but financial markets may need support
That is the kind of environment where volatility can rise quickly.
Other Forces Pushing Yields Higher
Several structural factors are also pushing Treasury yields upward.
Trump’s tariff policies are increasing costs.
The dollar’s share of global foreign exchange reserves has fallen from a peak of 72.7% to around 56%.
Global demand for dollar-denominated assets is weakening.
These are not short-term problems.
They point to a deeper shift in global capital flows
D Prime’s Observation
The rise in US Treasury yields is likely unavoidable.
Persistent inflation, fiscal deficits and weakening demand for dollar assets are all pushing yields higher.
The bigger question is not whether yields rise.
The real question is:
How high can yields go before the Fed has to respond?
2. What Warsh Wants to Change at the Fed
Warsh is not simply trying to continue Powell’s framework.
He wants to redesign parts of the Federal Reserve itself.
From Core PCE to Trimmed Mean PCE
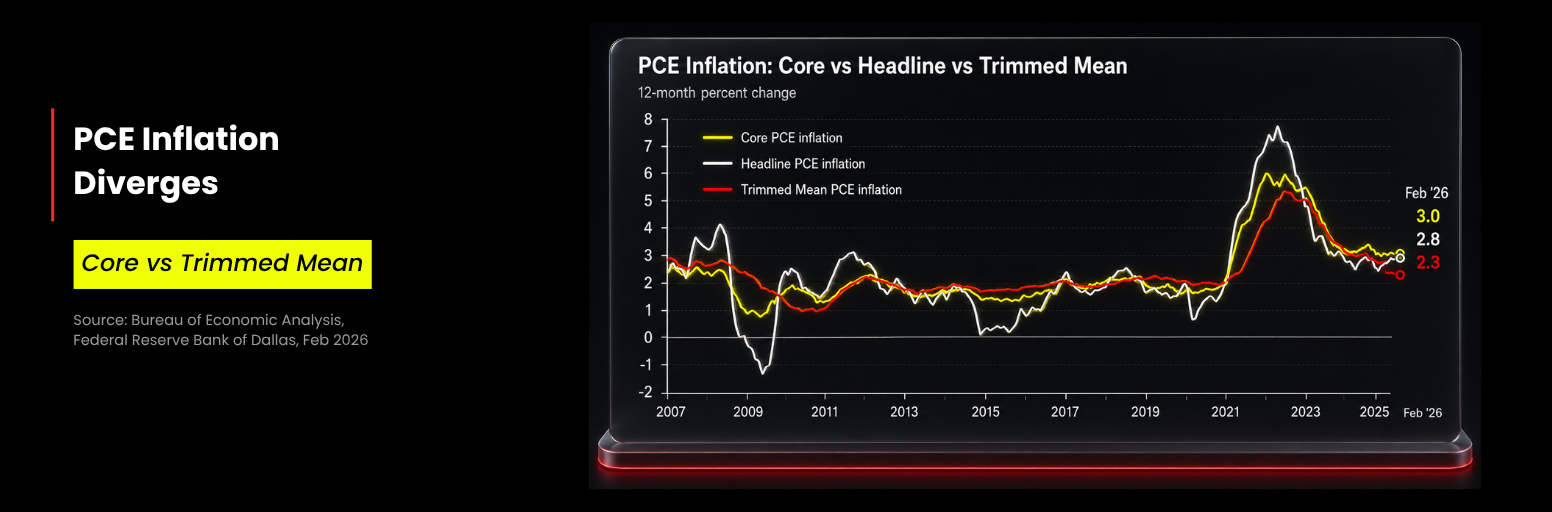
A major reform proposal under Warsh involves replacing Core PCE with Trimmed Mean PCE as a key policy guidance metric.
Trimmed Mean PCE removes a set percentage of items with the biggest price swings, then averages the rest. This creates a smoother view of inflation.
Under this framework:
- March Core PCE: 3.2%
- 12-month Trimmed Mean PCE: 2.4%
At first glance, this makes inflation look less severe.
That could open the door for future rate cuts.
But the Data May React Too Slowly
There is a risk.
Trimmed Mean PCE is smoother, but it can also be slower.
Take the 2020 pandemic as an example. If the Fed had relied heavily on Trimmed Mean PCE, it might not have cut rates aggressively enough to protect the economy.
Then in 2021, the market criticized Powell for reacting too slowly to inflation.
Warsh wants the Fed to have “steadfastness,” meaning it should not panic or overreact to every shock.
But too much steadfastness can become a problem.
If inflation accelerates and the Fed focuses too much on slower-moving data, policy may react too late. That could fuel inflation further, which would go against Warsh’s own goal of fighting inflation.
3. How Will Balance Sheet Reduction Work Under Warsh?
Warsh is not just trying to sound tough.
In our previous article, “The Next Fed Era: Kevin Warsh on Inflation and Rate Cuts,” D Prime explained that Warsh may actually be more dovish than he first appears.
His end goal is not to keep rates high forever.
He wants to create room for future rate cuts.
But before he can do that, he has to deal with liquidity first.
That means one thing:
balance sheet reduction.
The Big Problem: The US Is Deep in Debt
Here is where things get tricky.
As of May 18, total US government debt had reached around:
- USD 39 trillion
- about 120% of GDP
Interest payments alone now stand near:
- USD 1.2 trillion per year
- around 4% of GDP
That is a massive burden.
If the Fed reduces its balance sheet too aggressively, liquidity tightens. When liquidity tightens, government financing becomes harder and borrowing costs can rise further.
In simple terms, Warsh has to walk a very narrow bridge.
He needs to:
- fight inflation
- avoid shocking the market
- keep government funding conditions stable
Easy? Not even close.
The Fed’s Liquidity Puzzle
On March 26, Fed Governor Stephen Miran delivered a speech titled:
“A User’s Guide to Reducing the Federal Reserve’s Balance Sheet.”
It sounds technical, but the main idea is actually simple.
The Fed needs to figure out how much liquidity the financial system really needs.
There are three possible reserve environments:
- Scarce reserves
- Ample reserves
- Abundant reserves
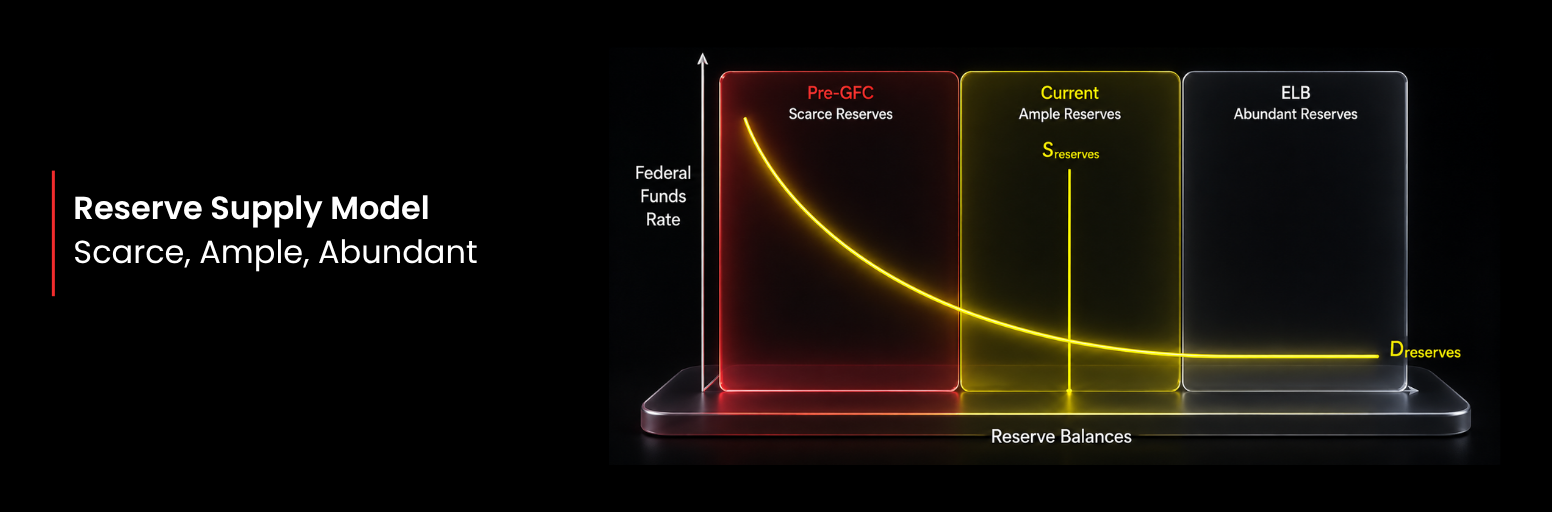
A scarce reserve system is dangerous because even small liquidity changes can cause interest rates to jump.
An abundant reserve system is easier to manage, but too much liquidity can support inflation and speculation.
Warsh will likely aim for the middle ground: an ample reserves framework.
That means the Fed can reduce liquidity gradually without creating a funding shock.
In trading terms, this means liquidity may get tighter, but not necessarily collapse overnight.
So How Can the Fed Shrink the Balance Sheet?
To reduce the balance sheet, the Fed has to pull liquidity out of the system.
But it cannot pull too much.
If it goes too far and pushes the system into scarce reserves, interest rates could become unstable.
So the likely strategy is:
- reduce the balance sheet gradually
- stay near the lower edge of the ample reserves range
- avoid triggering a liquidity shock
But Wait, How Does This Help Rate Cuts?
This is the key question.
If balance sheet reduction pushes rates higher, how does that help Warsh cut rates later?
The answer may come from banking regulation.
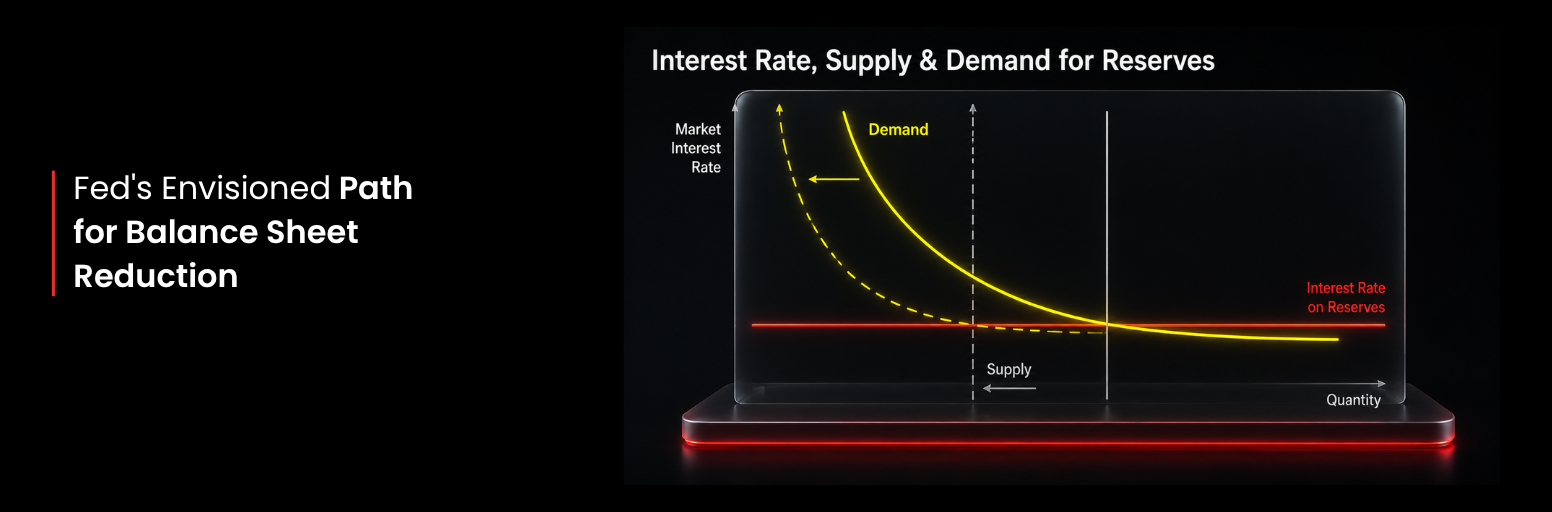
Because reserve demand is not fixed, the Fed can reduce how much reserves banks need to hold by relaxing certain regulatory requirements.
That shifts the demand curve lower.
In simpler terms:
banks need fewer reserves
the Fed can shrink its balance sheet more
interest rates do not have to spike as much
According to Miran’s estimate, this approach could create up to:
- USD 2 trillion
of room for balance sheet reduction.
That is the logic behind Warsh’s strategy.
Market Outlook: What Traders Should Watch
The Dollar Could Stay Strong
The US dollar may stay supported if Treasury yields remain high.
Higher yields attract capital, and during uncertain periods, investors still treat the dollar as a safe-haven asset.
A stronger dollar can pressure:
- emerging markets
- risk assets
For traders, dollar strength remains an important macro signal.
Gold May Stay Range-Bound
Gold may struggle to break out if the dollar stays strong and yields remain elevated.
Normally, higher real yields are negative for gold because gold does not pay interest.
However, the gold market is not moving only on yields. Central bank demand, geopolitical risk and reserve diversification are also important.
Since January, gold has traded mostly sideways despite inflation concerns and Middle East tensions.
D Prime’s observation is that gold may remain range-bound unless there is a major shift in inflation, Fed policy or geopolitical risk.
Treasury Yields May Rise Further, But There Is a Limit
US Treasury yields are still likely to trend higher in the foreseeable future.
But yields above 4.5% are already entering uncomfortable territory for financial markets.
At some point, excessively high yields begin tightening financial conditions too aggressively.
If yields continue climbing rapidly, the Fed may eventually need to step in and suppress them to avoid broader market instability.
In other words:
The Fed wants tighter liquidity.
But it does not want a broken market.
Stocks Are Still Being Carried by Earnings
Stocks are still being supported by earnings, especially in AI and semiconductors.
But liquidity risk is rising.
Technology stocks are usually more sensitive to interest rates because much of their valuation depends on future growth. When yields rise, future earnings are discounted more heavily.
That makes expensive growth stocks more vulnerable.
The AI trend may not be over, but traders should be careful chasing crowded momentum at high valuations.
Key risk:
If earnings momentum slows while yields stay high, equity volatility could rise sharply.
Oil Is Being Driven More by Geopolitics Than the Fed
Oil is currently being driven more by geopolitics than by Fed policy.
Middle East tensions continue to create supply-risk premiums. The market keeps moving between tension, easing and renewed tension.
As long as uncertainty remains, crude oil is likely to stay volatile.
Based on current market observations, D Prime believes oil may trade mainly in the $80 to $100 per barrel range in the near term.
The Bigger Picture
Markets are entering a very different environment from the ultra-loose liquidity era investors became used to over the past decade.
The next phase may involve:
- tighter liquidity
- structurally higher yields
- more selective market leadership
- higher volatility across asset classes
And under Warsh’s Fed, markets may need to adjust to a world where monetary policy becomes less supportive and more disciplined.
By D Prime Analysis Team
Macro and market strategy research by D Prime’s in-house analysis team.
Risk Disclosure
Trading in Securities, Futures, contracts for difference (CFDs) and other financial products carries high risks due to the rapid and unpredictable fluctuation in the value and prices of these financial instruments. This unpredictability is due to the adverse and unpredictable market movements, geopolitical events, economic data releases, and other unforeseen circumstances. You may sustain substantial losses, including losses exceeding your initial investment within a short period of time.
You are strongly advised to fully understand the nature and inherent risks of trading with the respective financial instrument before engaging in any transactions with us. When you engage in transactions with us, you acknowledge that you are aware of and accept these risks.
Disclaimer
The information contained herein is provided for general informational and educational purposes only and does not constitute investment advice, financial advice, trading advice or any other form of professional advice, a recommendation, or an offer or solicitation to buy or sell any financial instruments or engage in any trading strategy.
Trading in leveraged products such as contracts for difference (CFDs) involves a significant risk of loss and may not be suitable for all investors. Past performance is not indicative of future results. Any references to market trends, asset performance, price levels, or forward-looking statements reflect opinions or general market commentary as at the date of publication and are subject to change without notice.
This article does not take into account any individual investor’s objectives, financial situation, or risk tolerance. Readers should conduct their own independent research and seek professional advice before making any investment or trading decisions. D Prime and its affiliates make no representations or warranties about the accuracy or completeness or reliability of this information and disclaim any and all liability for any direct, indirect, incidental, consequential, or other losses or damages arising out of or in connection with the use of or reliance on any information contained herein. The above information should not be used or considered as the basis for any trading decisions or as an invitation to engage in any transaction. Do not rely on this article to replace your independent judgment.
“D Prime” is a brand name of D Prime Vanuatu Limited, a company incorporated and regulated by the Vanuatu Financial Services Commission (Company Number: 700238). The availability of products and services may vary depending on jurisdiction and applicable regulatory requirements.