Market Recap
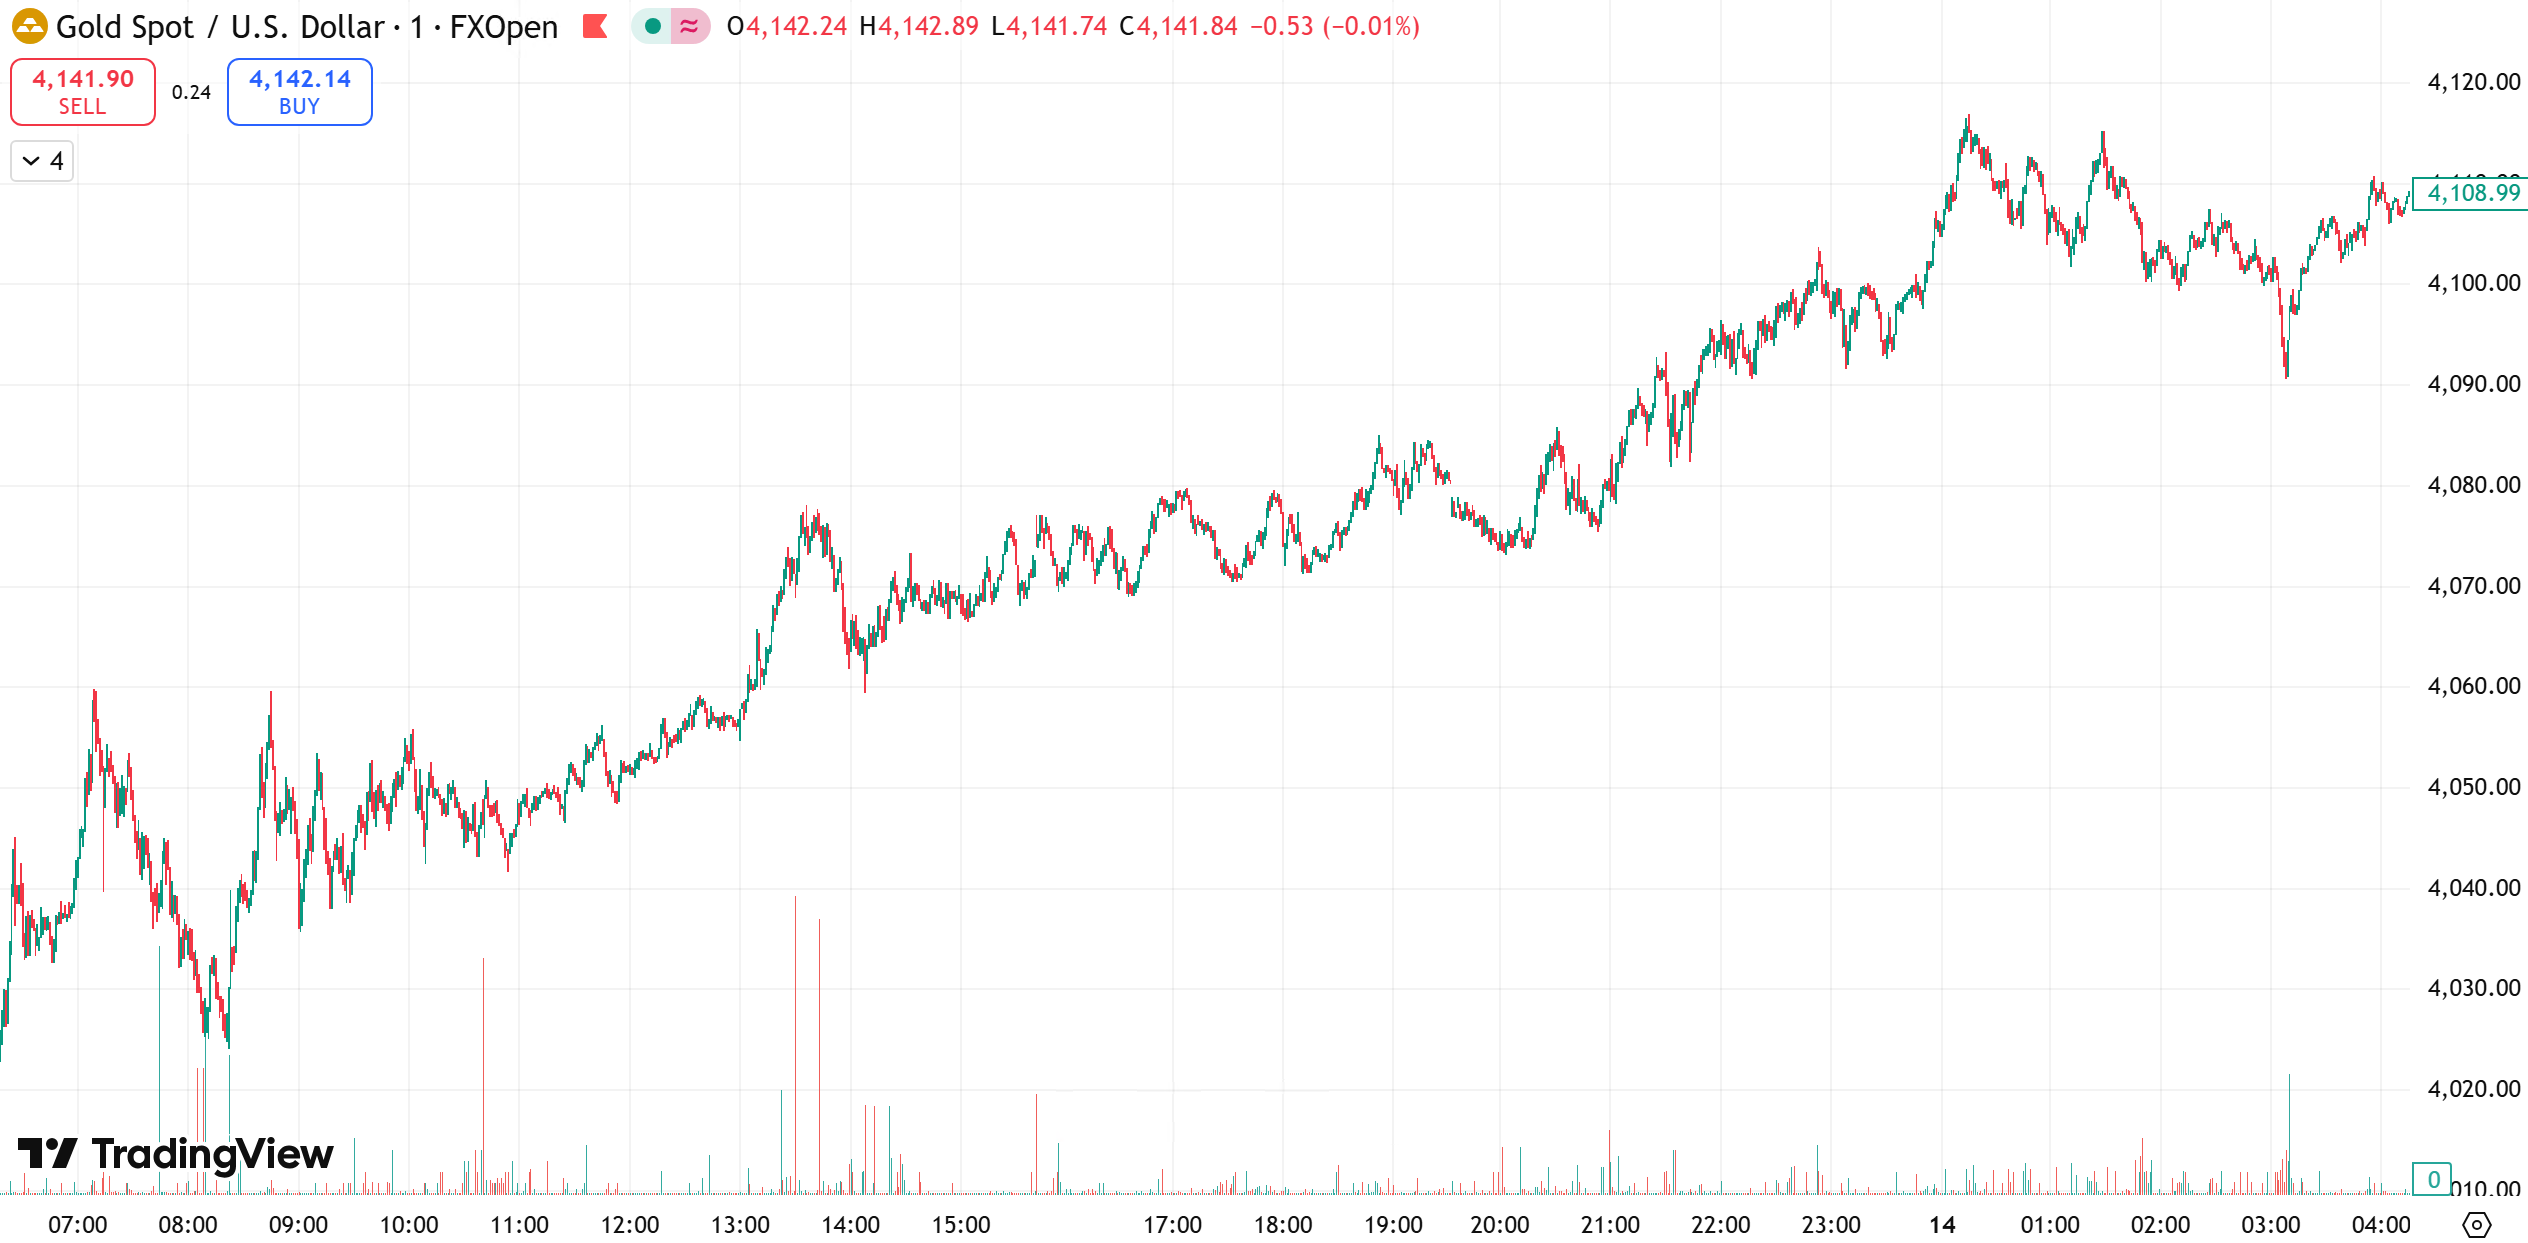
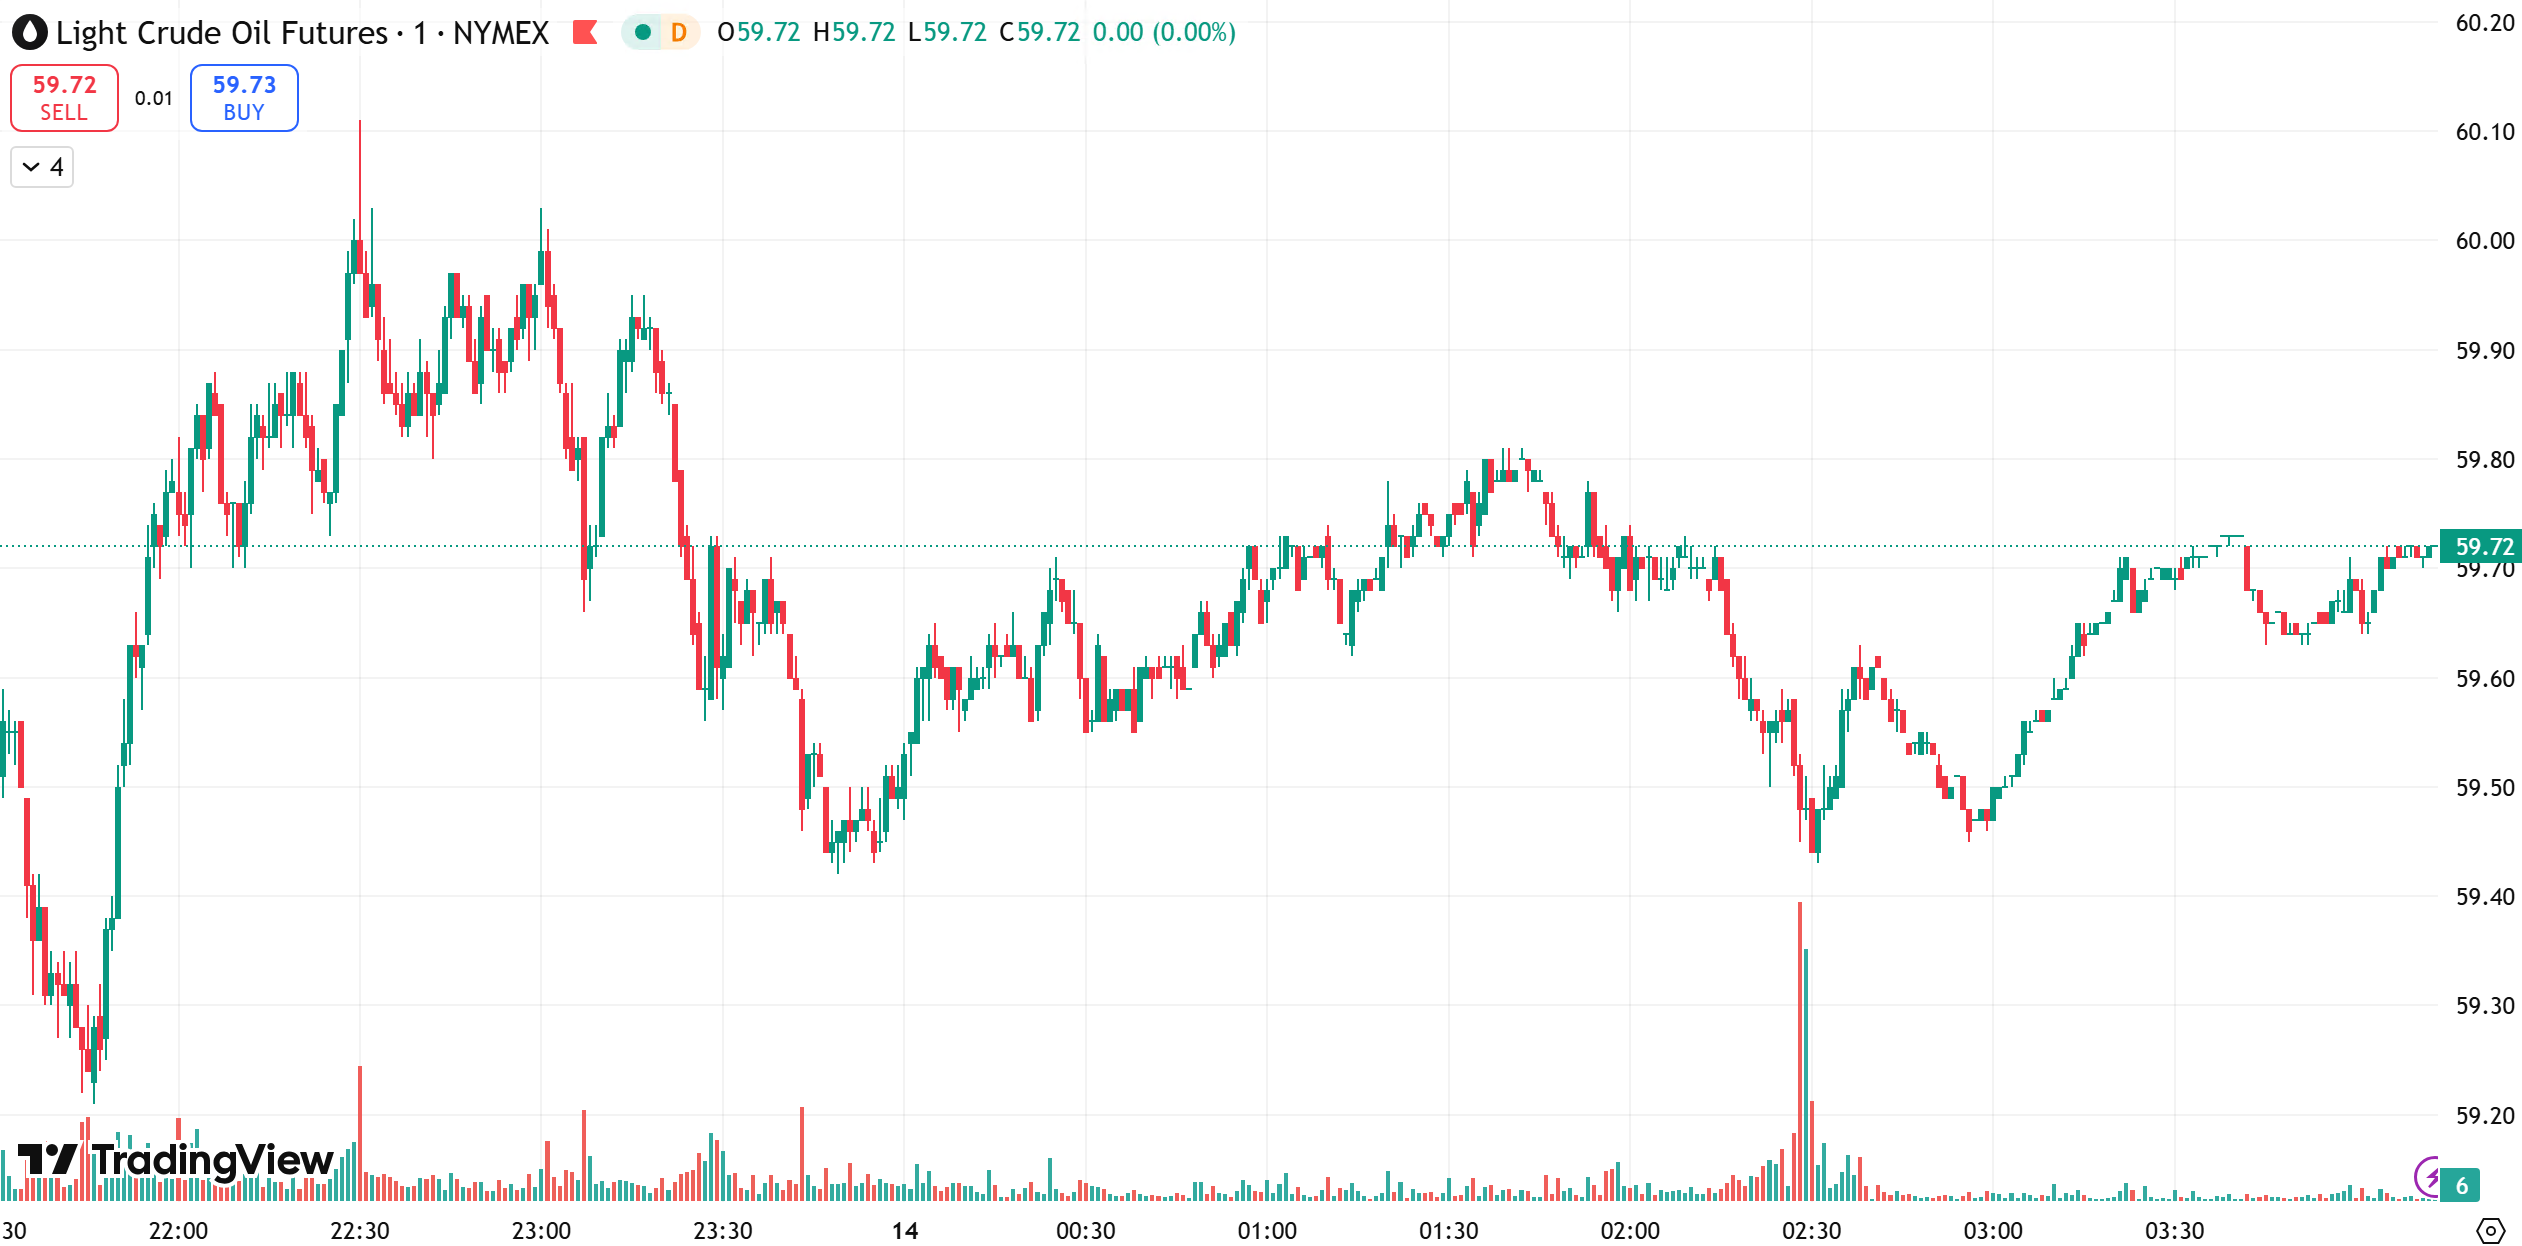
On Monday, spot gold traded near $4,114.42/oz, hitting another all-time high of $4,116.87/oz as renewed trade tensions and rate-cut expectations boosted safe-haven demand. US crude traded near $59.65/bbl, rising after signs that trade tensions had eased slightly.
Gold
Gold broke above $4,100/oz for the first time on Monday, setting a fresh record high of $4,116.87/oz, while silver also reached a new peak. The gains were driven by renewed trade uncertainty, expectations of further US rate cuts, and strong central bank buying.
So far this year, gold has surged 56%, fueled by geopolitical risks, Fed rate-cut bets, and steady central bank demand, after first crossing the $4,000 milestone last week.
Phillip Streible, Chief Market Strategist at Blue Line Futures, said, “Gold could easily maintain its upward momentum. By the end of 2026, we might see prices break $5,000/oz.”
Streible added that central bank purchases, ETF inflows, trade tensions, and lower US interest rates continue to provide structural support.
Traders currently price in a 97% chance of a 25 bps cut in October and a 100% chance of another cut in December. As a non-yielding asset, gold typically benefits from a low-rate environment.
Analysts at Bank of America and Société Générale expect gold to hit $5,000/oz by 2026, while Standard Chartered raised its 2025 average price forecast to $4,488/oz.
Technical outlook: On the weekly chart, Bollinger Bands continue to widen upward, and gold has formed eight consecutive bullish candles. Moving averages are aligned in a bullish pattern, confirming a strong uptrend. However, daily charts show extended overbought signals and potential top divergence, suggesting that correction risks are building. Analysts warn that only a major easing of global tensions could trigger large-scale profit-taking.
Today’s Gold Outlook:
- Strategy: Buy on pullbacks, sell on rebounds
- Resistance: $4,120 – $4,130
- Support: $4,080 – $4,070
Crude Oil
Oil prices climbed Monday as trade tensions between the world’s two largest economies appeared to ease, following a sharp sell-off last week that pushed benchmark prices to a five-month low.
Bessent, speaking on Fox Business, said the situation had “significantly de-escalated,” while DBS Bank analyst Suvro Sarkar noted that the recent sell-off “seems contained,” adding that short-term direction depends on the outcome of trade negotiations.
In a client report, PVM Oil Associates analysts warned that any slowdown in global trade would weigh on oil demand. Meanwhile, China’s September crude imports rose 3.9% YoY to 11.5 million bpd, and OPEC maintained its robust global demand forecasts for this year and next.
Technical outlook: From a daily perspective, oil remains in a medium-term downtrend, having broken below its trading range last week. The MACD lines are widening downward below zero, indicating strong bearish momentum. On the 1-hour chart, oil plunged below $60, hitting a new low near $57.80/bbl before a mild rebound. The trend remains weak, with downward momentum likely to continue.
Today’s Crude Oil Outlook:
- Strategy: Sell on rebounds, buy on dips
- Resistance: $61.0 – $62.0
- Support: $58.5 – $57.5
Risk Disclosure
Securities, Futures, CFDs and other financial products involve high risks due to the fluctuation in the value and prices of the underlying financial instruments. Due to the adverse and unpredictable market movements, large losses exceeding your initial investment could incur within a short period of time.
Please make sure you fully understand the risks of trading with the respective financial instrument before engaging in any transactions with us. You should seek independent professional advice if you do not understand the risks explained herein.
Disclaimer
This information contained in this blog is for general reference only and is not intended as investment advice, a recommendation, an offer, or an invitation to buy or sell any financial instruments. It does not consider any specific recipient’s investment objectives or financial situation. Past performance references are not reliable indicators of future performance. D Prime and its affiliates make no representations or warranties about the accuracy or completeness of this information and accept no liability for any losses or damages resulting from its use or from any investments made based on it.
The above information should not be used or considered as the basis for any trading decisions or as an invitation to engage in any transaction. D Prime does not guarantee the accuracy or completeness of this report and assumes no responsibility for any losses resulting from the use of this report. Do not rely on this report to replace your independent judgment. The market is risky, and investments should be made with caution.