In early Asian trading on Thursday, spot gold was holding near $4,609 per ounce after surging to a new all-time high of $4,642.77 on Wednesday. Spot silver also extended its rally, reaching a record $93.67 per ounce, as markets continued to trade within what analysts describe as a structural bull market driven by multiple macro and geopolitical forces.
Meanwhile, US crude was trading near $60.50 per barrel, with oil markets experiencing heightened volatility as short-term geopolitical tensions eased slightly but broader risks remained unresolved.
Gold
Precious metals extended their powerful rally on Wednesday. Spot gold surged to a fresh record high of $4,642.77 per ounce, while silver climbed to $93.67, also a historical peak. Analysts said the market remains firmly in a structural bull trend, supported by a combination of geopolitical risk, monetary policy uncertainty, and investor demand for hard assets.
Geopolitical tensions remain a key driver. Iran warned that if the United States intervenes in its domestic unrest, it would target US military bases in neighboring countries. At the same time, foreign ministers from Denmark and Greenland are preparing to meet US officials amid President Trump’s push to gain control of Greenland.
Macroeconomic data and Federal Reserve expectations are also reinforcing the rally. While US November retail sales and producer price data came in stronger than expected, traders continue to price in two Federal Reserve rate cuts later this year, following earlier softer core CPI readings. Meanwhile, ongoing concerns about the independence of the Federal Reserve continue to unsettle markets after the Trump administration threatened legal action against Fed Chair Jerome Powell, prompting rare public support from global central bank leaders.
Technical Outlook
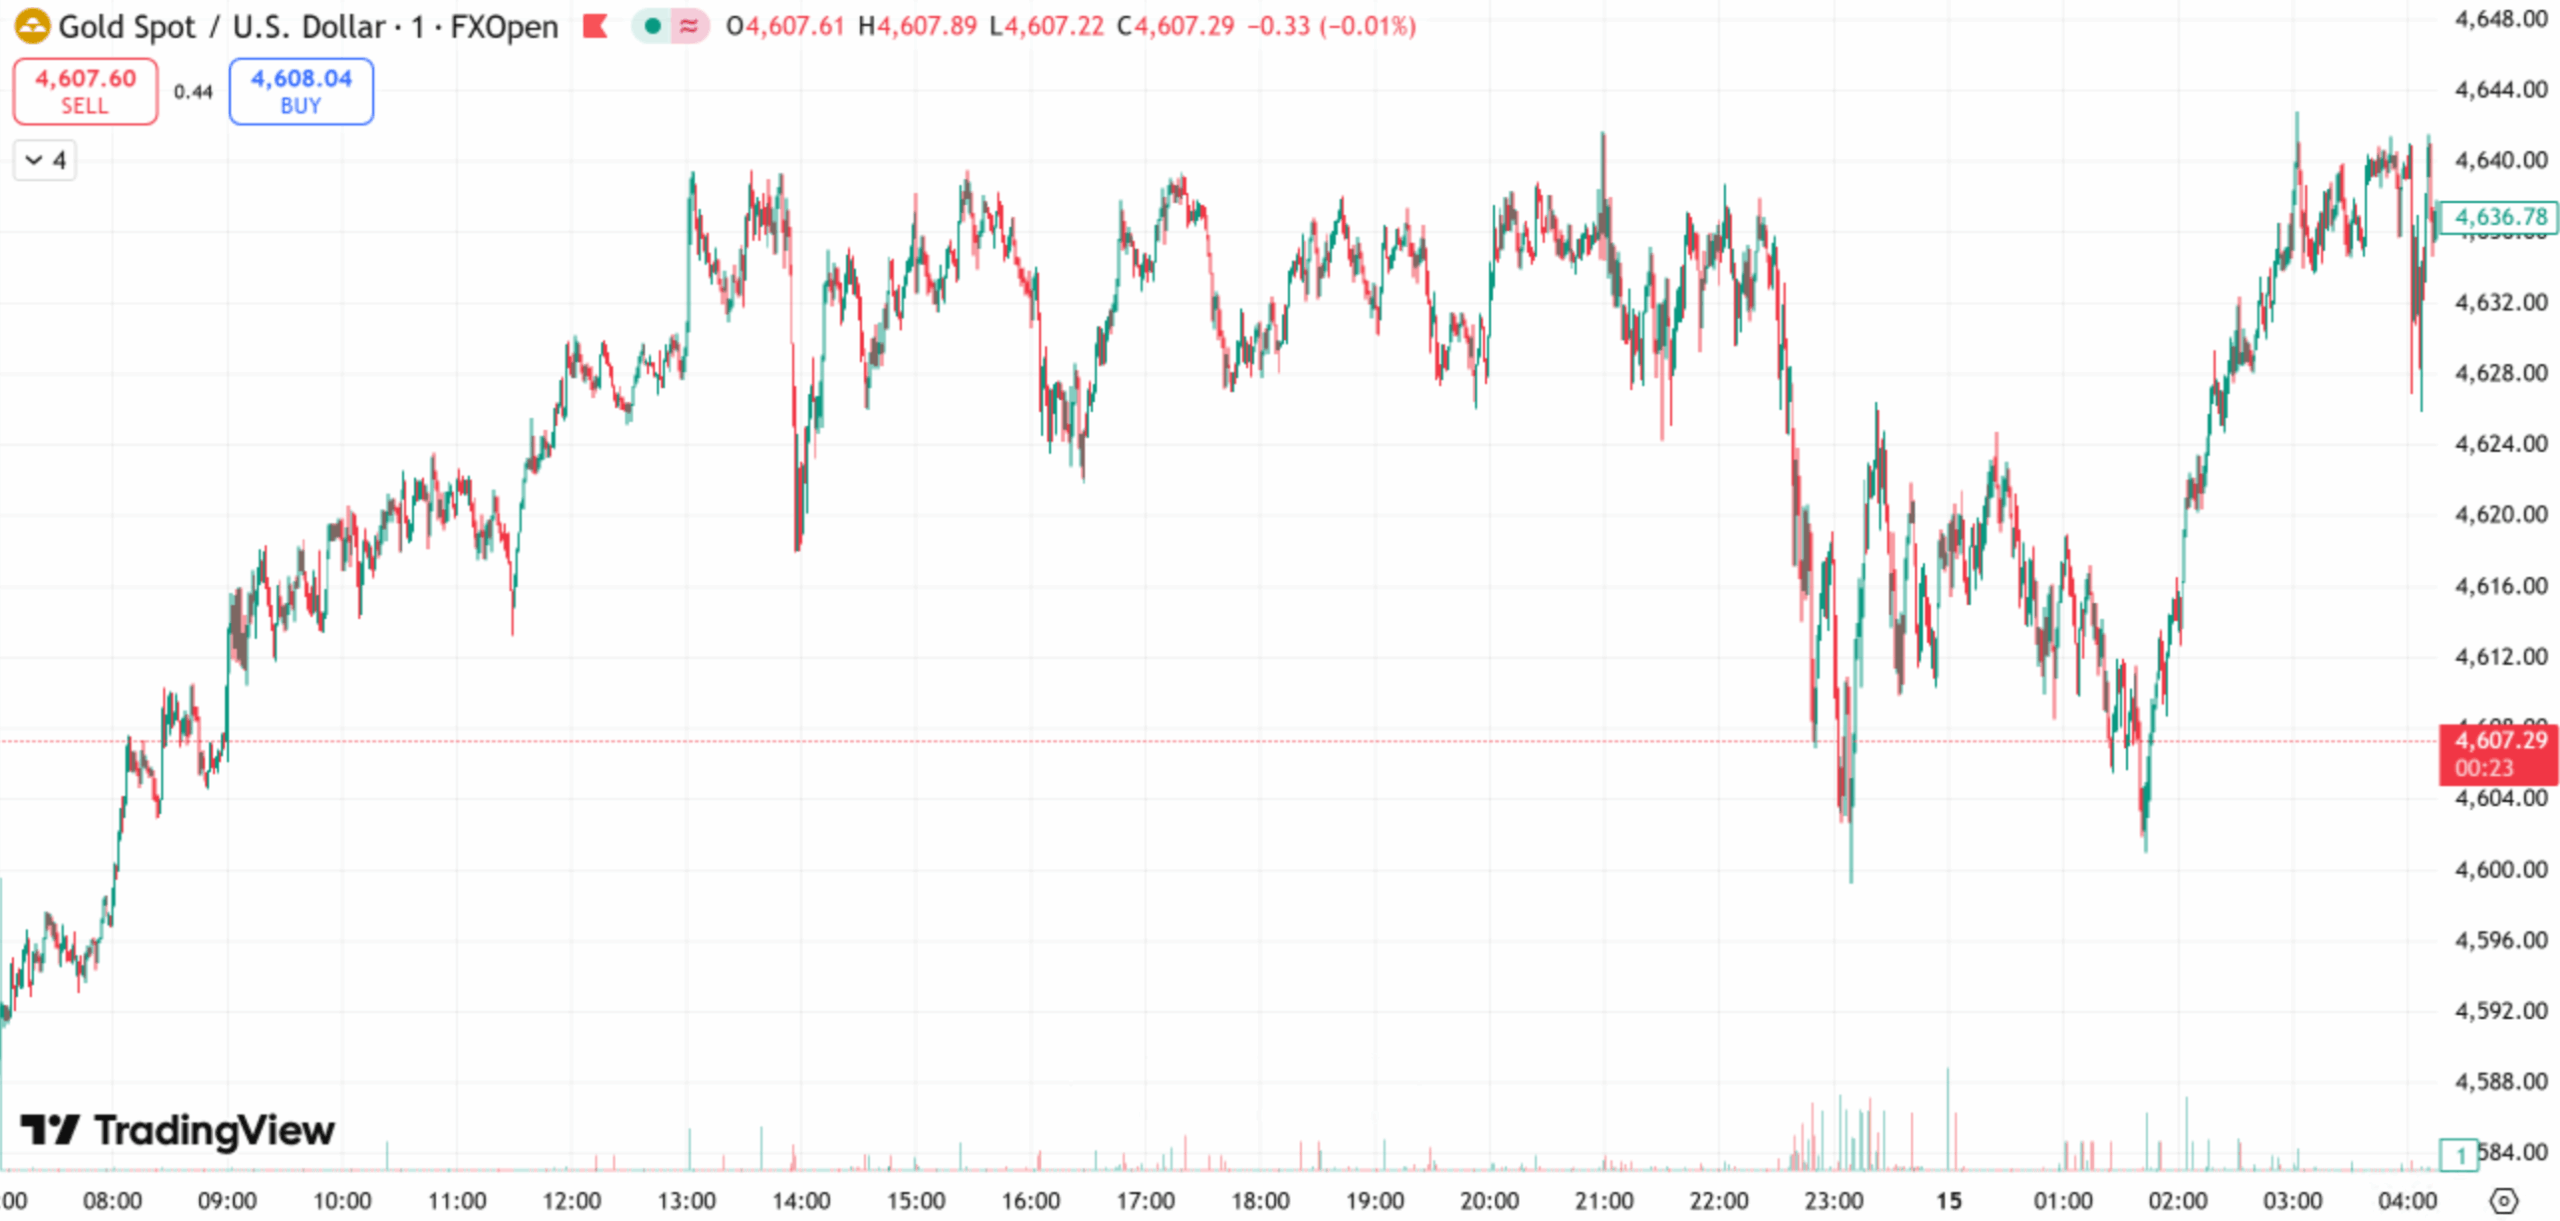
From a technical perspective, gold broke decisively above the 4,580–4,600 consolidation zone, briefly testing resistance near 4,640 before pulling back on profit-taking. Prices have now retreated toward the 4,590 area, a key technical support zone.
This level is supported by multiple factors: the 50-day moving average near 4,585, a former high-volume breakout area, and the 38.2% Fibonacci retracement of the recent rally from 4,530 to 4,640.
Momentum indicators suggest the uptrend remains intact. The MACD is still above the zero line despite narrowing, while the RSI has cooled from overbought levels to around 55, easing short-term overheating and allowing room for another leg higher.
Today’s Focus
Trading bias remains sell on rallies, buy on dips.
- Resistance: 4,590–4,610
- Support: 4,520–4,500
Oil
Oil prices delivered a dramatic reversal on Wednesday. Prices surged early on fears of potential Iranian supply disruptions, but later reversed sharply after President Trump said that “the killings in Iran’s crackdown are slowing”, easing fears of immediate conflict.
Brent crude fell 1.41% to $64.55, while WTI declined 1.57% to $60.19.
The sharp shift reflected a sudden cooling in geopolitical risk. Price Futures Group analyst Phil Flynn noted that markets quickly reassessed the likelihood of a military escalation, triggering aggressive selling.
However, underlying risks remain elevated. Iran has warned it would retaliate against US regional bases if attacked, and US officials confirmed that some personnel are being withdrawn from key locations as a precaution.
Fundamental data added further pressure. According to the US Energy Information Administration, crude inventories unexpectedly rose by 3.4 million barrels, while gasoline inventories surged by 9 million barrels, pointing to weaker demand or oversupply.
Technical Outlook
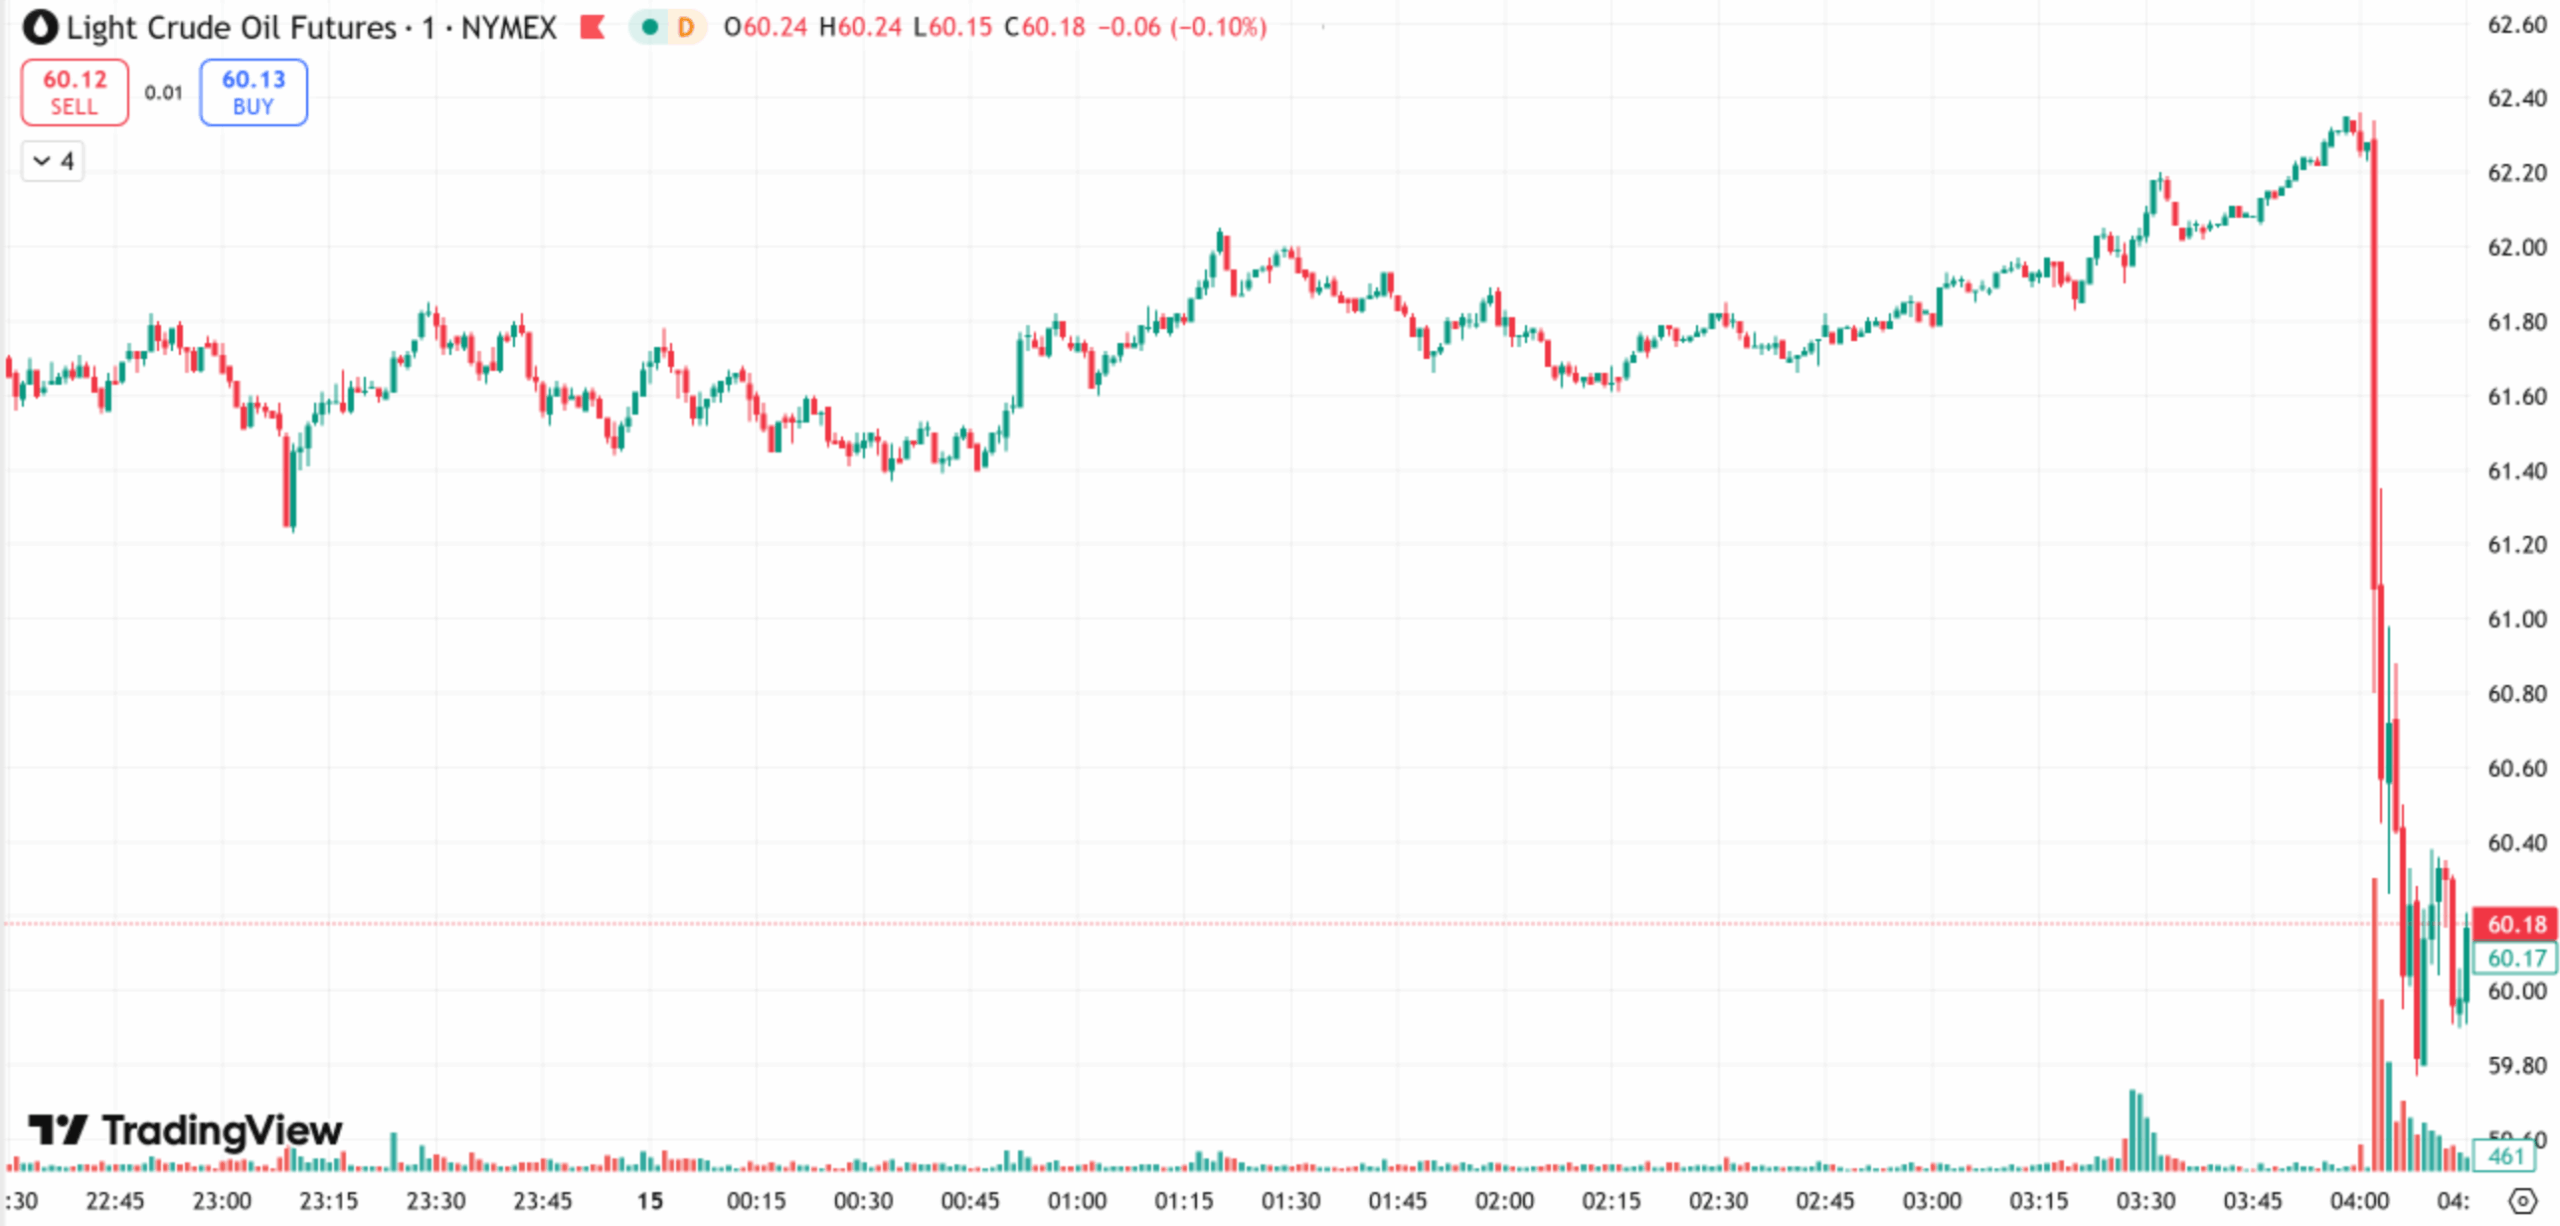
On the daily chart, crude entered consolidation near $62.36 before posting a strong bearish candle. Prices remain below key moving averages, keeping the medium-term trend bearish.
On the hourly chart, oil has broken to fresh short-term lows. Moving averages remain in a bearish alignment, while the MACD below zero confirms that downside momentum remains dominant. A small bounce is possible, but risks continue to point lower.
Today’s Focus
Trading bias remains sell on rallies, buy on dips.
- Resistance: 60.5–61.5
- Support: 59.0–58.0
Risk Disclosure
Trading in Securities, Futures, contracts for difference (CFDs) and other financial products carries high risks due to the rapid and unpredictable fluctuation in the value and prices of these financial instruments. This unpredictability is due to the adverse and unpredictable market movements, geopolitical events, economic data releases, and other unforeseen circumstances. You may sustain substantial losses including losses exceeding your initial investment within a short period of time.
You are strongly advised to fully understand the nature and inherent risks of trading with the respective financial instrument before engaging in any transactions with us. When you engage in transactions with us, you acknowledge that you are aware of and accept these risks. You should conduct your own research and consult with an independent qualified financial advisor or professional before making any financial, trading or investment decisions. This blog may contain speculative statements regarding future expectations, plans, or projections based on information and assumptions currently available to D Prime. Although D Prime considers these assumptions reasonable, such statements involve risks, uncertainties, and factors beyond D Prime’s control, and actual outcomes may differ significantly.
Disclaimer
This information contained in this blog is for general informational purposes only and should not be considered as financial, investment, legal, tax or any other form of professional advice, recommendation, an offer, or an invitation to buy or sell any financial instruments. The content herein, including but not limited to data, analyses and market commentary, is presented based on internal records and/or publicly available information and may be subject to change or revision at anytime without notice and it does not consider any specific recipient’s investment objectives or financial situation. Past performance references are not reliable indicators of future performance.
D Prime and its affiliates make no representations or warranties about the accuracy or completeness or reliability of this information and disclaim any and all liability for any direct, indirect, incidental, consequential, or other losses or damages arising out of or in connection with the use of or reliance on any information contained in this blog. The above information should not be used or considered as the basis for any trading decisions or as an invitation to engage in any transaction. Do not rely on this report to replace your independent judgment. You should conduct your own research and consult with an independent qualified financial advisor or professional before making any financial trading or investment decisions.

