Market Recap
Gold prices surged on Thursday, hitting a three-week high at $4,211/oz, as U.S. bond yields fell and rate-cut expectations gained momentum. Meanwhile, oil tumbled more than 4%, pressured by an OPEC report forecasting that global oil supply and demand will reach balance by 2026, signaling the end of a long-anticipated shortage narrative.
Gold
Spot gold jumped nearly 2% to $4,211.65/oz, its highest since October 21, while December futures climbed 2.4% to $4,213.60/oz.
Falling Treasury yields and stronger Fed cut expectations fueled the rally, with the 10-year yield dropping to its lowest since early November.
According to the CME FedWatch Tool, traders now see a 65% chance of a 25-basis-point cut in December.
Analysts at TD Securities noted that the end of the 42-day government shutdown will allow the release of delayed economic data, likely revealing a softening economy that supports further easing.
Gold Technical View:
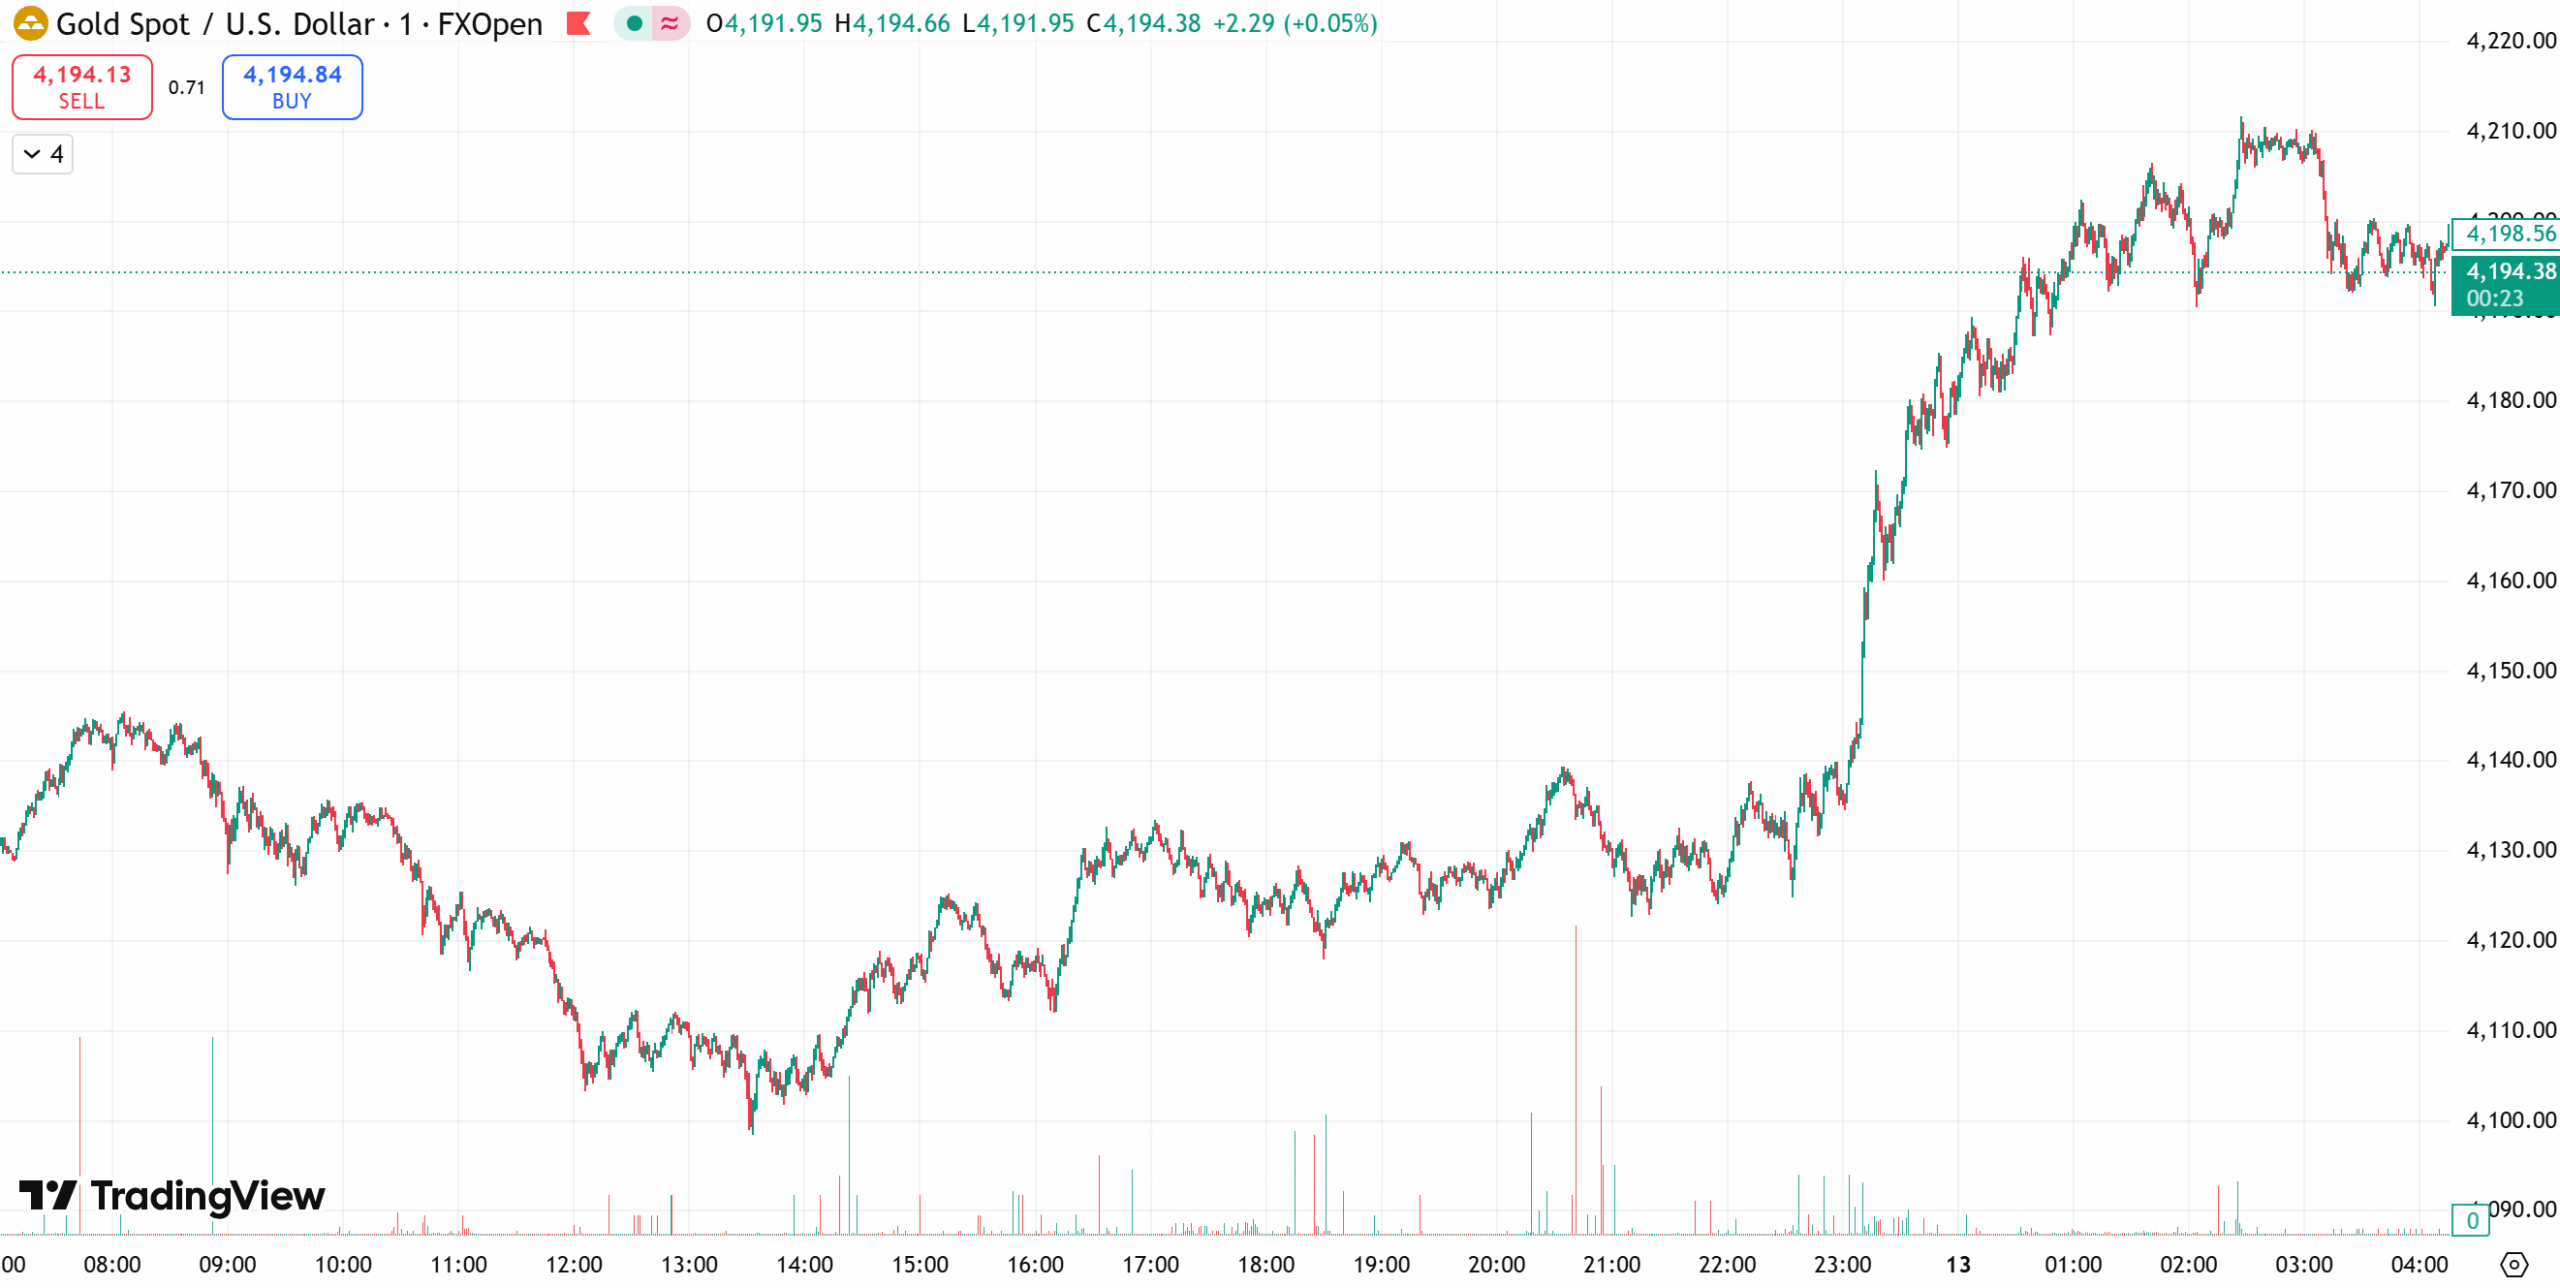
Gold broke out decisively after rebounding from the $4,100 support zone, surging past $4,150 resistance and peaking near $4,211. The trend remains bullish, with key support at $4,150–$4,130 and strong resistance near $4,250. As long as gold trades above the $4,150 level, the bullish structure stays intact, suggesting more upside potential.
Today’s Gold Outlook:
- Strategy: Buy on dips, sell on rebounds.
- Resistance: $4,220–$4,250
- Support: $4,160–$4,130
Oil
Oil prices fell sharply on Wednesday, with Brent crude down 3.76% to $62.71/barrel and WTI down 4.18% to $58.49/barrel, after OPEC projected that global oil supply will match demand by 2026. The shift from a deficit to balance outlook sent a strong bearish signal to the market.
Analysts said the projection “reinforced the perception that the market is entering a state of equilibrium,” undermining the bullish narrative that had supported prices for months.
In contrast, the International Energy Agency (IEA) maintained a longer-term bullish stance, forecasting continued oil and gas demand growth through 2050, diverging from climate-aligned scenarios.
Technical View:
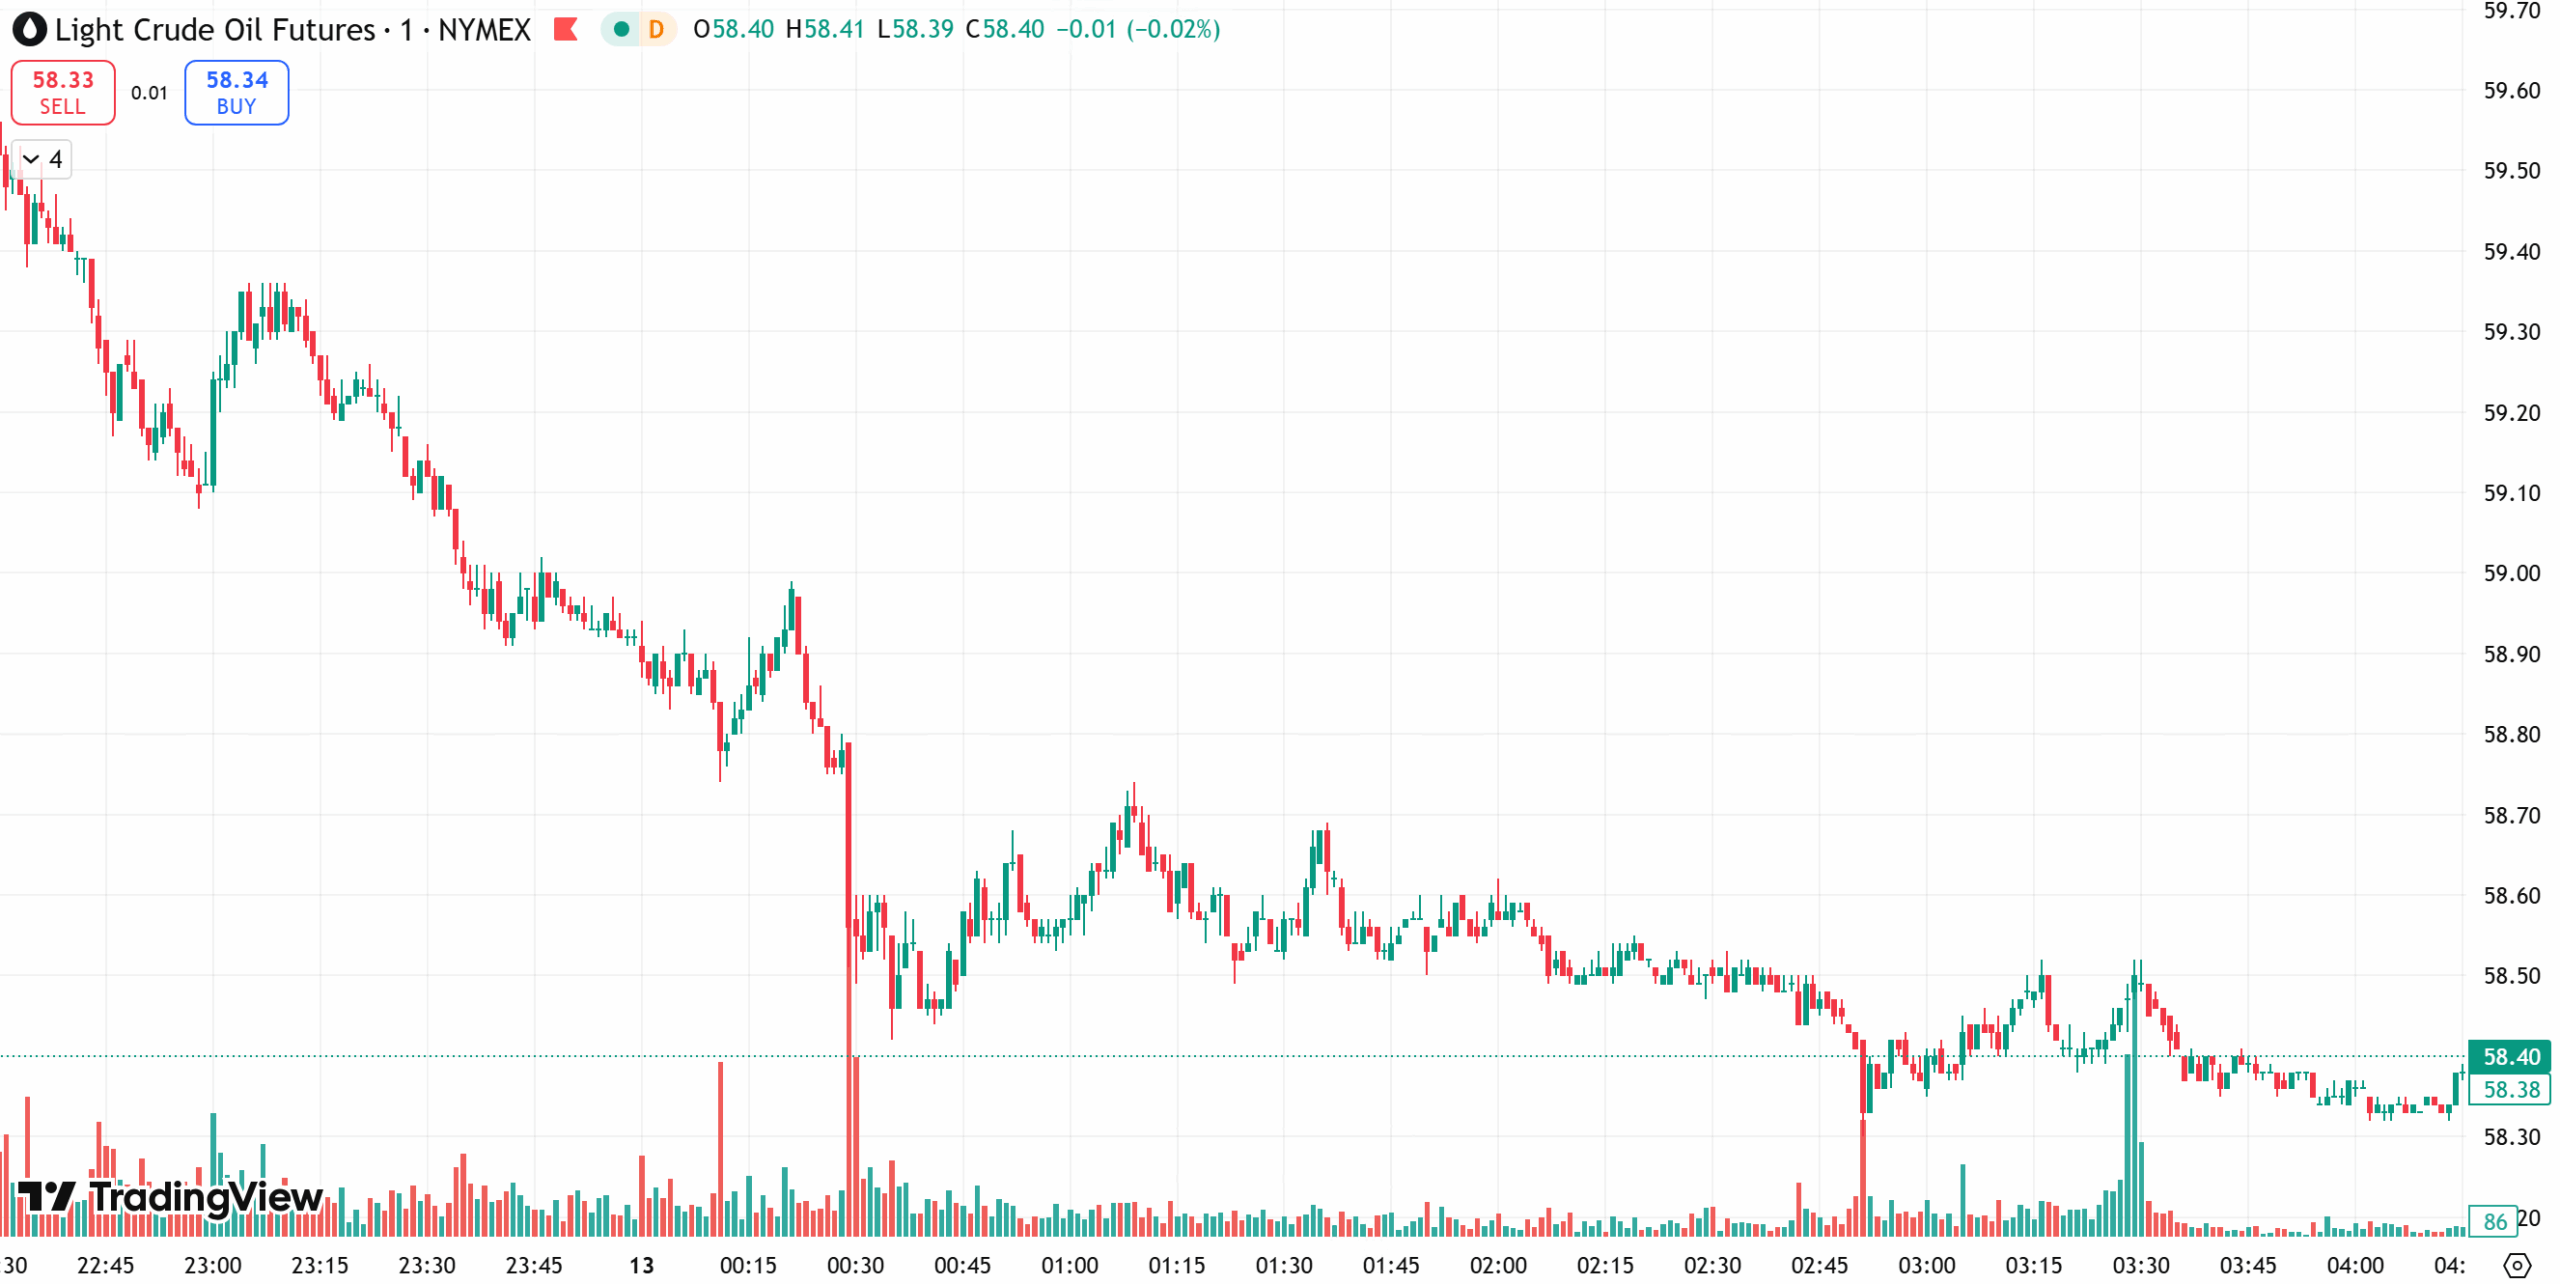
From a daily perspective, oil remains in a corrective phase. Although short-term charts suggest limited upside, the MACD indicates that bullish momentum could rebuild after the pullback. Intraday resistance is seen at $59.5–$60.5, while support sits near $57.0–$56.0.
Today’s Outlook:
- Strategy: Buy on dips, sell on rebounds.
- Resistance: $59.5–$60.5
- Support: $57.0–$56.0
Risk Disclosure
Securities, Futures, CFDs and other financial products involve high risks due to the rapid and unpredictable fluctuation in the value and prices of these underlying financial instruments. This unpredictability is due to the adverse and unpredictable market movements, geopolitical events, economic data releases, and other unforeseen circumstances. You may sustain substantial losses including losses exceeding your initial investment within a short period of time.
You are strongly advised to fully understand the nature and inherent risks of trading with the respective financial instrument before engaging in any transactions with us. When you engage in transactions with us, you acknowledge that you are aware of and accept these risks. You should conduct your own research and consult with an independent qualified financial advisor or professional before making any financial, trading or investment decisions.
Disclaimer
This information contained in this blog is for general informational purposes only and should not be considered as financial, investment, legal, tax or any other form of professional advice, recommendation, an offer, or an invitation to buy or sell any financial instruments. The content herein, including but not limited to data, analyses and market commentary, is presented based on internal records and/or publicly available information and may be subject to change or revision at anytime without notice and it does not consider any specific recipient’s investment objectives or financial situation. Past performance references are not reliable indicators of future performance.
D Prime and its affiliates make no representations or warranties about the accuracy or completeness of this information and disclaim any and all liability for any direct, indirect, incidental, consequential, or other losses or damages arising out of or in connection with the use of or reliance on any information contained in this blog. The above information should not be used or considered as the basis for any trading decisions or as an invitation to engage in any transaction.
D Prime does not guarantee the accuracy or completeness of this report and assumes no responsibility for any losses resulting from the use of this report. Do not rely on this report to replace your independent judgment. You should conduct your own research and consult with an independent qualified financial advisor or professional before making any financial, trading or investment decisions.